Definition:
A reliability block diagram (RBD) is a system modeling method that draws a system as blocks wired in series and parallel to show whether it succeeds or fails. If you can trace an unbroken path through working blocks from input to output, the function works. Series blocks mean everything must work; parallel blocks mean redundancy. Like fault tree analysis, RBD is a Boolean, static technique, so it captures the logical structure of failure but not its behavior over time.
“Given how these components are arranged and voted, will a working path survive the failures, and how often will it not?”
In functional safety, RBD is the backbone of the simplified PFD equations used in SIL verification. You split a safety instrumented function into its sensor, logic solver, and final element subsystems, draw each block with its voting architecture, and combine them. Series blocks add their probabilities of failure, and parallel (redundant) blocks multiply.
How it fits: RBD, fault tree analysis, and event tree analysis are all boolean modeling methods, but they sit in different parts of the lifecycle. Fault tree analysis (FTA) and event tree analysis (ETA) typically model the hazard scenario during hazard and risk analysis, while RBD models the safety system’s own reliability during SIL verification via the simple equations.
Key Points:
- Components are drawn as series and parallel blocks; a continuous path of working blocks means the function succeeds.
- It is a Boolean, static method like fault tree analysis, so it shows failure logic but not time behavior, which means care is needed with proof-test intervals.
- In SIL verification it is the structure behind the simplified PFD equations: series blocks add, redundant parallel blocks multiply.
Example:
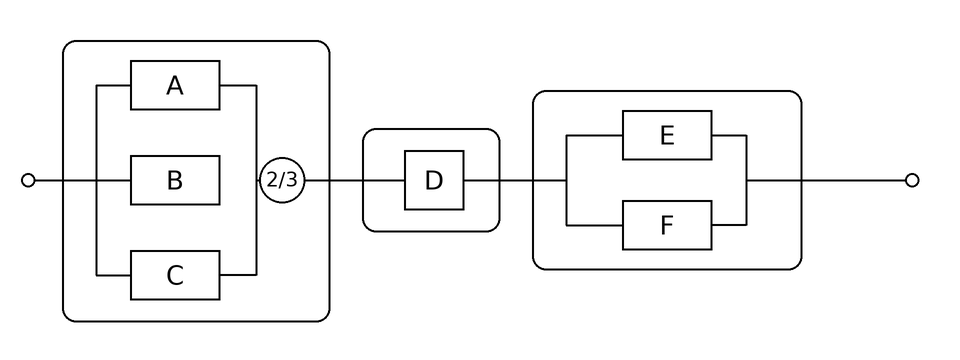
The diagram above shows a typical safety instrumented function as an RBD: three pressure transmitters voting 2oo3, feeding a single safety PLC, driving two shutdown valves in 1oo2. The transmitters and valves are drawn in parallel because the function survives one failure, while the logic solver sits in series because if it fails, the whole function fails.
See Also: FTA, ETA, markov model, bowtie analysis
Cited Source:
- IEC 61508-6:2010, Annex B – reliability block diagram approach for PFD calculation
- IEC 61078 – reliability block diagrams (RBD) standard