Definition:
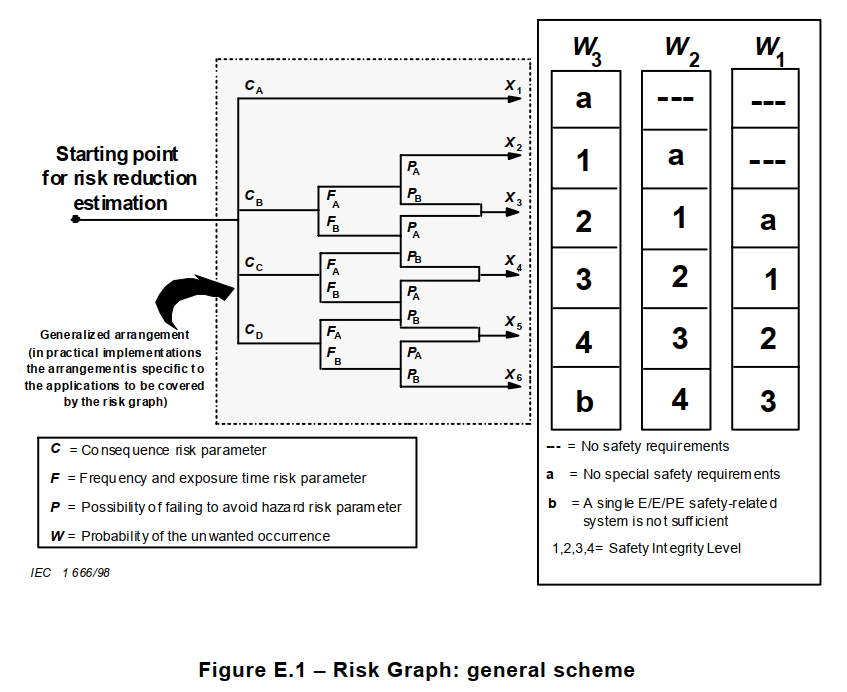
A Risk Graph is a semi-quantitative risk assessment (SQRA) tool used to assess risks and estimate required SIL levels by mapping severity, frequency, and exposure factors. It is a common approach along with a LOPA, and a bit easier. Thus it can perform both the H&RA and SIL Selection portions of the Functional Safety Lifecycle.
Don’t confuse it with a Risk Matrix!
Key Points:
- Simpler and faster than quantitative risk assessment (QRA).
- Frequently used early in a project’s hazard assessments.
- Often used in machinery safety and the EU Machinery Directive
Example:
High-consequence, high-frequency events map to a SIL 3 requirement using a Risk Graph.
See Also: H&RA, risk matrix, LOPA, SQRA
Cited Source:
- IEC 61511-3:2016, Annex E
- IEC 61508-5:2010, Annex D
- Mary Kay O’Connor Process Safety Center – On the Use of LOPA and Risk Graphs for SIL Determination