Safe failure percent, also called “% Safe Failures”, is the fraction of a device’s total failure rate that fails to the safe state, meaning the state that drives the process toward its tripped, de-energized condition. A safe failure pushes the device toward tripping; a dangerous failure pushes it toward not responding when called.
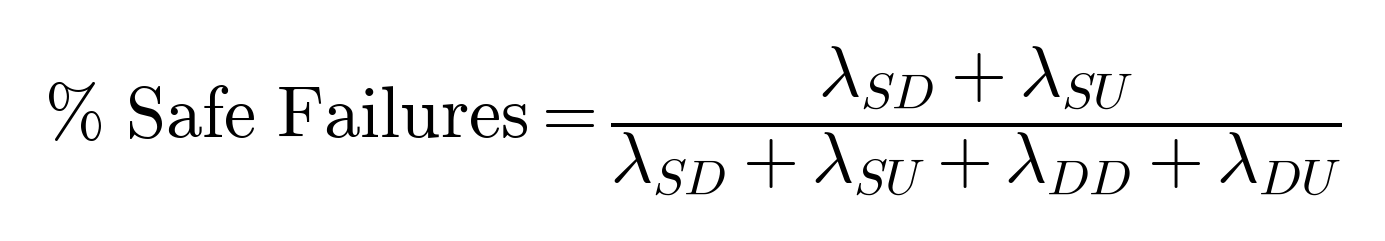
The point worth watching, and the well-known Kenexis SIS Engineering Handbook calls this out explicitly, is that safe failure percent is not the Safe Failure Fraction (SFF), but very close! Both ratios share the same denominator, and the numerator differs by a single term. SFF credits dangerous-detected failures (λDD), because diagnostics catch them, so SFF always comes out larger than % Safe Failures and the two are equal only when λDD is zero. They also serve different jobs. SFF feeds the architectural constraints (hardware fault tolerance), while % Safe Failures feeds the λS / λD split. Swap one for the other and you corrupt your failure-rate math.
Worth flagging for practitioners: % Safe Failures is not a formal IEC term, so the plain safe-versus-dangerous split ratio gets called several loose things (“safe ratio”, “safe fraction”, “% safe”) and people slide between it and SFF without noticing the λDD swap. The real confusion lives in what the data says. some datasets hand you λS, λD, and SFF directly, while other sources publish a “% safe” split factor. Be careful.
Key Points
- It is not the SFF; same denominator, but SFF adds dangerous-detected failures (λDD) to the numerator and is therefore always larger.
- Used to allocate a vendor’s stated failure rate into safe and dangerous components before a PFD calculation.
- The Kenexis SIS Engineering Handbook uses this term and prints an explicit warning against confusing it with SFF.
- Terminology confusion: data sources report either a “% safe” split or SFF, and feeding one in place of the other silently corrupts the λS / λD split.
Example
A pressure transmitter has documentation that provides a total failure rate λ of 0.05/year and a % Safe Failures of 60%. The safe portion is λS = 0.60 × 0.05 = 0.03/year and the dangerous portion is λD = 0.40 × 0.05 = 0.02/year. It is the λD value that flows into the PFD calculation for the safety function.
See Also: SFF, failure rate, diagnostic coverage
Cited Sources
- Kenexis, SIS Engineering Handbook — defines % Safe Failures and distinguishes it from SFF
- IEC 61508-2:2010 — defines Safe Failure Fraction (SFF), the related but distinct architectural-constraint metric