Most engineers learn hazard and risk analysis methods one at a time, in the order their careers happened to expose them. HAZOP in a class. LOPA when they joined a site that used it. Bowtie in a corporate training deck. Years pass and they end up fluent in a handful of methods without ever assembling a clean mental model of how the methods fit together.
That gap creates real problems. Teams default to whatever their site does and can’t articulate why, can’t recognize when the wrong tool is being used, and outgrow their methodology without realizing it. IEC 61511 requires a hazard and risk assessment (H&RA) but is method-agnostic. The choice of hazard and risk analysis methods is on you, and the right choice depends on your facility, your scenarios, and the depth of analysis your risk picture demands.
The Two Halves of Hazard and Risk Assessment
Clause 8 of IEC 61511 requires both halves of an H&RA: hazard identification and risk assessment.
Hazard identification is discovery work: what can go wrong here? The output is a list of credible scenarios with causes, consequences, and existing safeguards.
Risk assessment is evaluation work: for each identified hazard, how bad is it, how likely is it, and how much risk reduction is needed to make it tolerable? The output is a defensible determination of required risk reduction, often expressed as a Safety Integrity Level (SIL) when the reduction is allocated to a Safety Instrumented Function (SIF).
Most method confusion comes from not recognizing which half a given tool serves. HAZOP is hazard identification. LOPA is mostly risk assessment. They do different cognitive work, and they aren’t interchangeable.
Another source of confusion: some methods are treated differently by different practitioners. The same method can be identification-only at one site and identification-plus-assessment at another. This article names the common patterns, but your facility may run them differently.
Hazard Identification Methods
The hazard and risk analysis methods in this section are collectively known as Process Hazard Analysis (PHA) methods in much of industry practice. PHA usually refers to the identification activity specifically, while H&RA is the IEC 61511 phrasing for the full activity covering both halves.
HAZOP
A Hazard and Operability Study (HAZOP) is a hazard identification method by design, but in practice it often extends into risk assessment. Two patterns are worth recognizing:
- HAZOP-as-identification: the team identifies hazards, applies a risk ranking for prioritization, and hands the scenarios off to LOPA or risk graph for assessment. Cleaner pattern, dominant at larger facilities.
- HAZOP-as-everything: the team identifies hazards and uses a calibrated risk matrix to determine SIL requirements directly, with no separate risk assessment step. Common at smaller facilities and in revalidations.
The workshop mechanics are the same either way. A multidisciplinary team works node-by-node through the process, applying parameter and guideword combinations (no flow, more pressure, reverse flow) to surface deviations from design intent. HAZOP is time-intensive, depends heavily on facilitator skill, and works best on continuous processes.
What-If (Typically Run as What-If/Checklist)
What-If is a hazard identification method. A team works through the process asking open-ended what if questions and brainstorms consequences and safeguards.
In practice almost nobody runs pure What-If — the risk of missing something obvious is too high. What sites actually do is What-If/Checklist: the team brainstorms freely, then uses a backing checklist as a safety net to catch what was missed. When practitioners say “we did a What-If,” they almost always mean What-If/Checklist.
What-If/Checklist is the practical alternative to HAZOP for smaller, simpler, or batch processes. It’s accepted under major regulatory frameworks (OSHA Process Safety Management in the US, COMAH in the UK, Seveso in the EU) and is the right call for Management of Change (MOC) reviews, Pre-Startup Safety Reviews, and revalidations of well-understood operations.
Pure Checklist
Pure checklist is verification, not discovery — the team walks through a pre-built list of standard hazards or design conditions for that process type and confirms each one is addressed. It’s used for screening reviews, very simple operations, or as an MOC tool for minor changes.
Example: a process safety engineer is evaluating a proposed minor MOC. They walk through a standard checklist (does it change relief valve sizing, introduce new hazardous materials, affect classified area boundaries, touch a SIF), and the checklist confirms whether a fuller PHA review is needed.
Related but Out of Scope: FMEA and FMEDA
Failure Modes and Effects Analysis (FMEA) and Failure Modes, Effects and Diagnostic Analysis (FMEDA) don’t belong in the H&RA toolkit. Equipment-level FMEA and FMEDA belong to device certification under IEC 61508, the manufacturer’s domain, with outputs consumed by IEC 61511 users during SIS design and SIL verification. Process FMEA exists as a hazard identification method in adjacent industries (pharma, food, automotive) but isn’t standard in the process industry. Not covered further.
Risk Assessment Methods
LOPA
Layer of Protection Analysis (LOPA) is a risk assessment method. It serves the assessment half of the H&RA, but it straddles the Clause 8 / Clause 9 boundary of IEC 61511. The analytical work is risk assessment under Clause 8, while the output feeds SIL allocation under Clause 9. That dual nature is why LOPA gets described both ways depending on context.
The mechanics are semi-quantitative and scenario-based. For each scenario, the team multiplies the initiating event frequency by the probability of failure on demand of each Independent Protection Layer (IPL) credited against the scenario, then compares the residual risk to the tolerable risk criterion. Where residual risk exceeds tolerable, the gap defines the required risk reduction factor (RRF) and corresponding SIL.
LOPA is the most widely adopted risk assessment method globally, the default tool for most facilities. Its strengths are visible math, defensible documentation, and scalability across hundreds of scenarios. Its limitations are real: order-of-magnitude resolution can hide meaningful differences, and IPL crediting requires real discipline. Sloppy IPL crediting produces inflated risk reduction credit and leaves real gaps.
Risk Graph
Risk graph is a risk assessment method. A calibrated decision tree uses four parameters: consequence severity (C), frequency or exposure (F), possibility of avoidance (P), and demand rate (W). The path through the tree lands on a SIL.
Risk graph compresses risk assessment and SIL selection into a single traversal: consequence severity, exposure, avoidance, and tolerable risk comparison are all baked into the calibrated tree. It’s common in European-influenced practice, in oil & gas globally, and in machinery safety; it remains a fully legitimate IEC 61511-3 method.
Strengths: speed, no failure rate data required for IPLs, easy to teach. Limitations: calibration is everything, sensitivity is poor, qualitative judgments hide assumptions that LOPA forces explicit.
LOPA and Risk Graph Are Alternatives, Not Complements
Both methods occupy the same workflow slot: risk assessment with a SIL output. Running both on the same scenario set creates conflicting answers and an unauditable documentation trail. Sites pick one or the other as their site standard and apply it consistently.
The Quantitative Deep-Dive Methods
FTA, ETA, and bowtie are risk assessment tools, not hazard identification tools. Like LOPA and risk graph, they require an upstream identification activity to define what gets analyzed. They cannot tell you what hazards you forgot to consider.
Fault Tree Analysis (FTA)
FTA works top-down and deductively. Start with a top event and work backward through the failure combinations that produce it using Boolean logic. Logic gates (AND, OR), basic events with failure rates, and minimal cut sets give a quantified frequency for the top event.
Strengths: rigorous quantification, handles complex failure logic, identifies common cause failure (CCF) contributors. Limitation: FTA only analyzes the top event you defined. It cannot surface hazards nobody named.
Event Tree Analysis (ETA)
ETA is the structural mirror of FTA: bottom-up and inductive. Start with an initiating event and work forward through outcome paths, assigning branching probabilities at each protection layer or conditional modifier (ignition / no ignition, immediate vs. delayed, occupancy at the time).
The output is the full consequence space mapped quantitatively. Limitation: ETA is only as good as the initiating event you picked.
Bowtie Analysis: The Integrating Visual
A bowtie puts the hazardous event in the middle, with threats and causes on the left (FTA territory), consequences on the right (ETA territory), and barriers across both sides. It can be qualitative (illustrative) or quantitative (backed by FTA/ETA data).
Bowtie’s strength is communication: management, operations, and maintenance can read a bowtie even if they can’t read a fault tree. It’s also powerful for barrier management, making preventive and mitigative barriers visible together. Limitation: a bowtie is only as rigorous as the analysis behind it. A whiteboard sketch is not an H&RA.
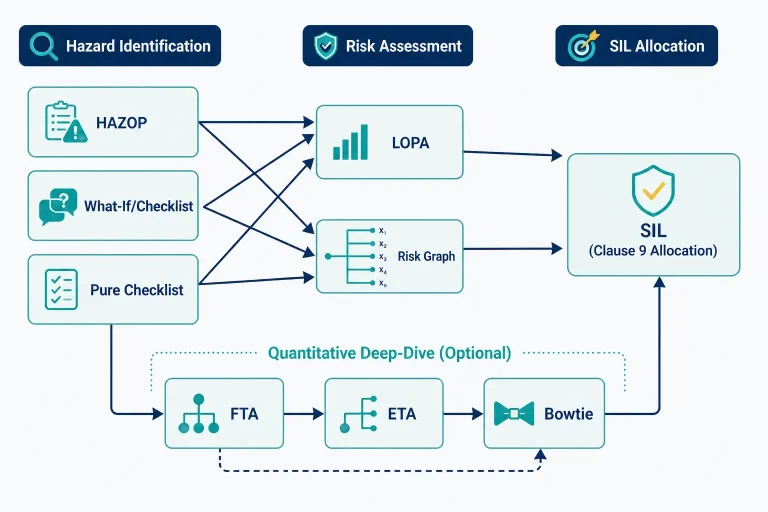
How a Complete H&RA Comes Together
A complete H&RA combines hazard and risk analysis methods from both halves: one for identification, one for assessment. Several pairings are common in practice.
The Common Pairing: HAZOP + LOPA
HAZOP plus LOPA is the dominant H&RA pairing globally. HAZOP identifies, LOPA assesses, with a clean handoff between the two halves. The pairing extends one step beyond H&RA. LOPA’s output feeds Clause 9 SIL allocation directly.
The Alternative Pairing: HAZOP + Risk Graph
Same handoff structure, different risk assessment tool. Common in European-influenced practice. Site-wide methodology choice. Risk graph outputs a SIL directly, also feeding Clause 9 allocation.
The Quantitative Pairing: Identification + FTA/ETA + Bowtie
Reserved for high-consequence facilities or specific scenarios within an otherwise LOPA-based program. Identification can be HAZOP or another systematic method, but the upstream identification step cannot be skipped. The Common Mistakes section below walks through what happens when it is.
The Small-Facility Pattern: What-If/Checklist (or HAZOP) + Calibrated Risk Matrix
A single workshop does identification, assessment, and SIL determination using a calibrated matrix. The identification method is What-If/Checklist for smaller operations; some sites use HAZOP and run it the same way. The matrix serves double duty: both the tolerable risk reference and the SIL determination output. Common at facilities that don’t have the scenario count to justify a separate LOPA program. The matrix’s resolution caps how defensible higher-SIL determinations can be.
Why You Can’t Skip Hazard Identification
FTA and ETA both start from a known event. LOPA and risk graph both evaluate scenarios they’re given. None of them can tell you what hazards you forgot to analyze. Identification and assessment are different cognitive tasks, and skipping the identification step doesn’t reduce the rigor of the H&RA. It produces a different activity that happens to share vocabulary with one.
Common Mistakes
The mistakes below show up across all the hazard and risk analysis methods covered in this article. They’re field-grounded patterns, not generic warnings about following the standard.
1. Doing a high-quality assessment on a hazard while forgetting that not all hazards have been identified.
A specialty chemical facility decides to do a quantitative analysis on a 50,000-gallon flammable solvent tank. The team builds a rigorous fault tree on loss of containment, an event tree on ignition and consequences, and a bowtie that ties it all together. The analysis is technically excellent. A SIL is assigned to the overfill protection SIF.
Six months later, an operator opens a sample valve that sticks open. Several thousand gallons release into a containment area not designed for that volume, and an uncoordinated maintenance activity provides the ignition source. None of it was in the analysis. Nobody ever did systematic hazard identification. The team jumped straight to “tank fire” as the assumed hazard and built outward.
FTA and ETA are powerful at analyzing hazards you’ve already named. They cannot tell you what hazards you forgot to name. That’s HAZOP’s job.
2. Mixing LOPA and risk graph on the same scenario set. Two methods occupying the same workflow slot produces conflicting answers and unauditable documentation.
3. Crediting IPLs in LOPA without independence and auditability discipline. Loose IPL crediting inflates risk reduction credit and leaves real gaps. Independence, auditability, and access integrity have to be earned, not assumed.
4. Drawing a bowtie without the underlying analysis. A diagram with barriers in marker is a communication tool, not an assessment.
5. Defaulting to whatever the site has always done. Methodology should match process complexity and scenario severity, not just inherit.
6. Treating FTA and ETA as substitutes for HAZOP. They analyze hazards deeply. They don’t discover them.
Q&A
Q1. I sometimes hear PHA and sometimes H&RA. Are they the same thing?
PHA is the umbrella term most practitioners use, particularly in CCPS-influenced documentation, and usually refers to the hazard identification activity specifically. H&RA is the IEC 61511 phrasing for the full activity covering both identification and assessment. Practitioners sometimes use PHA loosely to mean the whole exercise, which is part of where the confusion comes from.
Q2. How do I know if my site is using the wrong H&RA method?
This is a hard question and often needs the judgment of experienced professionals to answer well. Some clues:
- Mismatch: a small facility running a full quantitative program for routine scenarios is using more methodology than the risk profile warrants; a complex high-consequence facility relying on a calibrated risk matrix for SIL determination is using less methodology than the risk profile warrants
- Inconsistency: scenarios assessed by different methods with no documented basis for the choice, or IPLs credited differently across similar scenarios
Q3. Can FTA and ETA satisfy IEC 61511’s H&RA requirement on their own?
No. FTA and ETA take hazardous events as a design input. The methods cannot generate the events themselves. Something upstream has to identify them, which is the work of a hazard identification method like HAZOP. Without that step, the quantitative analysis is rigorous about whatever events the team happened to think of, and silent about everything else.
Q4. Is risk graph an acceptable method, or do I have to use LOPA?
Risk graph is a fully legitimate IEC 61511-3 method. The standard does not mandate LOPA. The right choice depends on facility context. Risk graph is common in European-influenced practice, oil & gas globally, and machinery safety; LOPA dominates in many regulatory contexts, particularly under PSM/RMP. What’s not acceptable is mixing the two on the same scenario set.
Q5. My boss says HAZOP takes too many people for too many days and costs too much. Why can’t we just do a What-If/Checklist?
Sometimes you can. What-If/Checklist is a legitimate hazard identification method, accepted under OSHA PSM, COMAH, Seveso, and similar frameworks. It’s the right tool for smaller, simpler, or batch processes, for MOC reviews, and for revalidations of well-understood operations. The choice should be based on process complexity and consequence severity, not on cost alone. Cost is a real factor, and not every scope warrants a full HAZOP. As process complexity, scenario count, or consequence severity increase, the cost-benefit shifts back toward HAZOP. Using What-If/Checklist on a scope that genuinely needs HAZOP is how facilities miss hazards that come back to bite them later.
Q6. Where does LOPA actually sit in the IEC 61511 life-cycle, Clause 8 or Clause 9?
Both. The analytical work is risk assessment under Clause 8. The output (required risk reduction expressed as a SIL) is consumed by Clause 9 for protection layer allocation. LOPA spans the boundary, which is why it’s described both as an H&RA method and a SIL determination method.
Q7. Do I need a bowtie for every hazardous event?
No. Bowtie is most valuable for high-consequence scenarios where barrier management and stakeholder communication justify the effort. For routine scenarios handled in a HAZOP and LOPA workflow, a bowtie adds little beyond what the LOPA worksheet documents.
Further Reading
- SIL Safe: Hazard and Risk Assessment (H&RA): The Foundation of Functional Safety
- SIL Safe: Layer of Protection Analysis (LOPA): The Engineer’s Guide to SIL Selection
- IEC 61511-3:2016: informative annex on risk assessment methods
- CCPS, Guidelines for Hazard Evaluation Procedures, 3rd Edition
- CCPS, Layer of Protection Analysis: Simplified Process Risk Assessment
- OSHA PSM 29 CFR 1910.119: PHA requirements for US-regulated facilities (paragraph (e))
- HSE COMAH guidance: UK regulatory framework for major accident hazards
Functional safety is complex, and the stakes are high. If you have questions about your SIS design, SIL verification, or where to start with IEC 61511-1, the team at SIL Safe is here to help. Reach out to us today.