
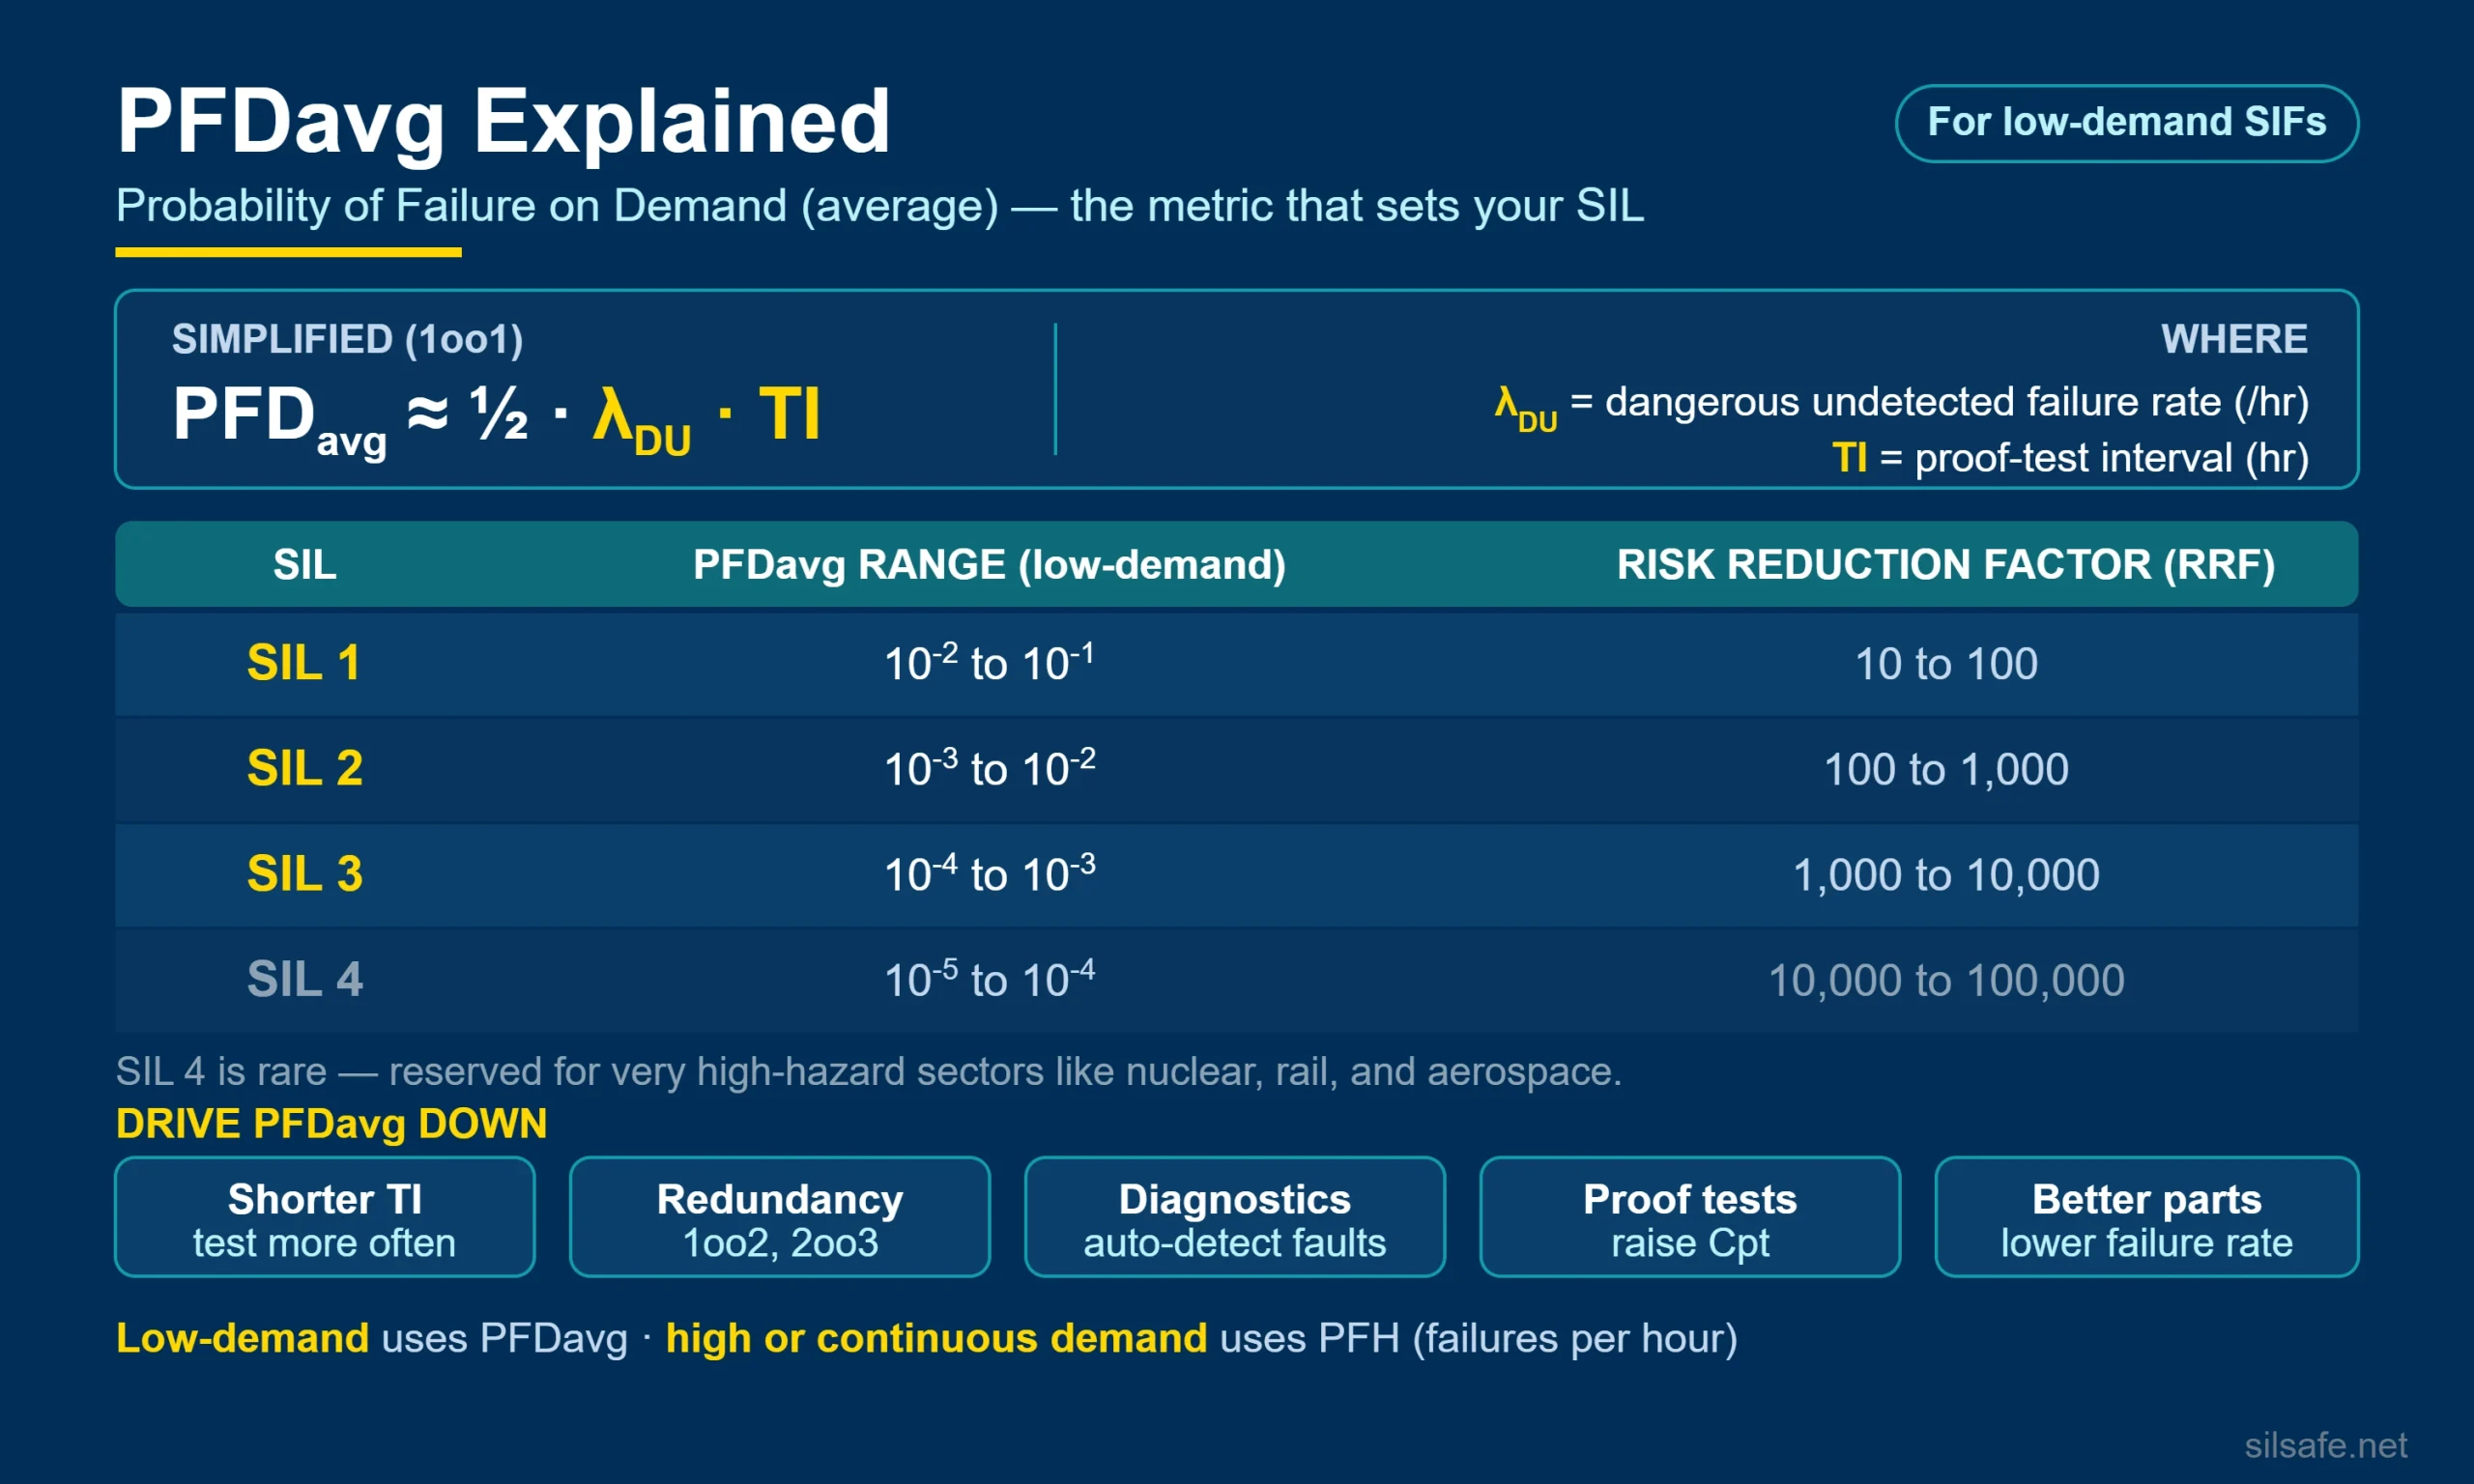
Understanding PFDavg—short for Probability of Failure on Demand, average—is foundational if you’re new to functional safety and the IEC 61511 framework. Whether you’re supporting a Safety Instrumented System (SIS) in oil & gas, biogas, chemicals, or any other process industry, developing a solid understanding of this metric helps you design safer systems and comply with regulatory expectations.
This guide walks you through six essential concepts about PFDavg that every engineer should understand when evaluating or designing Safety Instrumented Functions (SIFs).
1. What Is PFDavg and Why It Matters
A Safety Instrumented Function (SIF) is a specific set of equipment—usually an instrument, logic solver, and final element—designed to take a process to a safe state when a defined hazardous condition is detected.
PFDavg is the average likelihood that a Safety Instrumented Function (SIF) will fail when it’s needed. It quantifies the chance that your safeguard won’t respond in a dangerous situation—basically, the “gap” in protection.
Most SIS applications operate in low-demand mode, meaning they’re called upon infrequently (e.g., fewer than once per year). For these systems, PFDavg is the go-to metric for quantifying performance.
Why does it matter? Because PFDavg is directly tied to your Safety Integrity Level (SIL) target. If your value is too high, your SIF doesn’t meet the required SIL—and that means your process risk isn’t sufficiently reduced.
External resource: ISA Functional Safety
2. How PFDavg Determines Safety Integrity Level (SIL)
The Safety Integrity Level (SIL) is a measure of how much risk reduction a SIF provides. It’s defined by using thresholds. The following table summarizes the P ranges and associated risk reduction factor (RRF) for each SIL level:
| SIL Level | PFDavg Range | RRF Range |
|---|---|---|
| SIL 1 | ≥1.0E-2 to <1.0E-1 | 10 to <100 |
| SIL 2 | ≥1.0E-3 to <1.0E-2 | 100 to <1,000 |
| SIL 3 | ≥1.0E-4 to <1.0E-3 | 1,000 to <10,000 |
| SIL 4 | ≥1.0E-5 to <1.0E-4 | 10,000 to <100,000 |
In the process industry, you’ll typically see SIL 1 to SIL 3 used. SIL 4 is rare and generally reserved for nuclear, rail, or aerospace applications.
External reference: IEC Functional Safety
3. The Core PFDavg Equation
For low-demand systems, a simplified PFDavg formula looks like this (PFDavg ≈ ½ × λDU × TI):
Note this is the simplified equation for the simplest architecture available. Believe me when I say, this gets more complicated at different architectures and different approaches.
4. The Other Variables and Concepts that move PFDavg
Test Interval
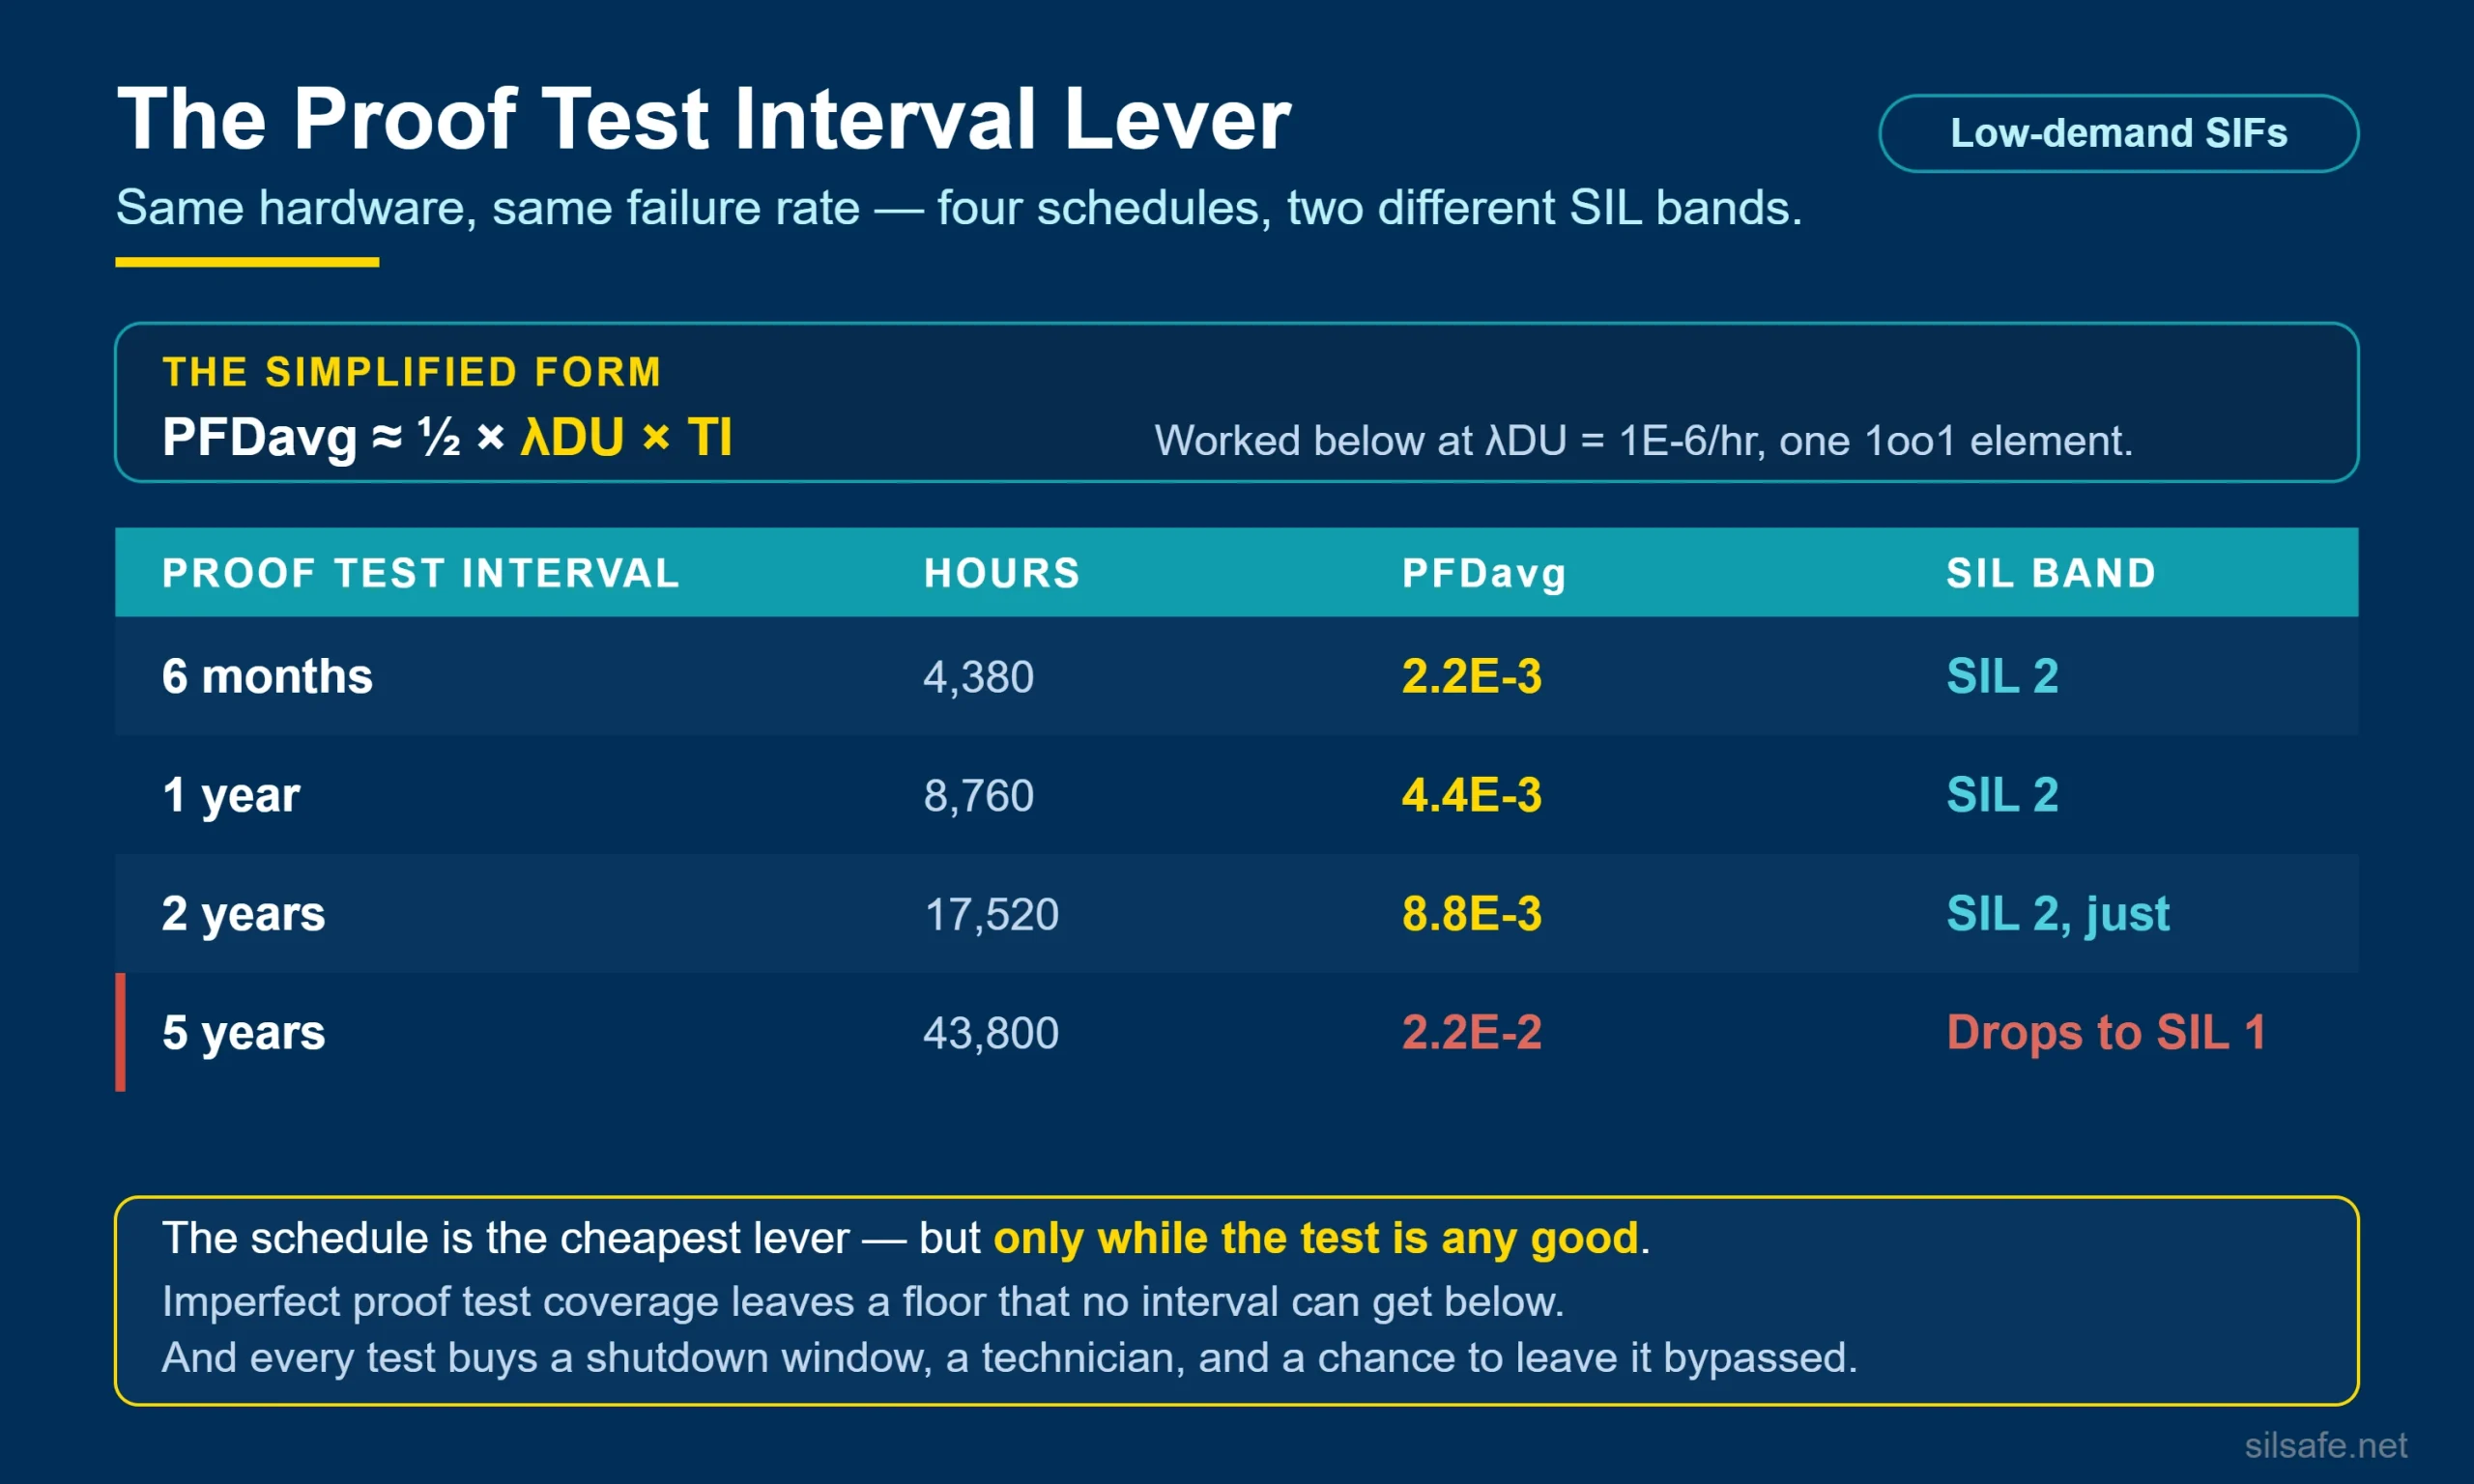
This is the maximum time permitted between proof tests of each SIF. It can be dictated by the math (such as choosing a TI to get the SIL desired). Or it can be dictated by a site policy. Typical values are 6 months or 1 year. Can also be shorter for things like partial valve stroke tests and longer for hard to reach places. You can see below its impacts.
Mean Time to Restore (MTTR)
The average time it takes to restore the system to a working state once a failure is discovered. This influences overall system unavailability. (Future article topic)
Proof Test Coverage (Cpt)
Represents the fraction of dangerous undetected failures that are revealed by a proof test. The higher the Cpt, the more effective the test, and the lower your average probability of failure on demand. This is especially critical in systems that lack built-in diagnostics. (Future article topic)
Common Cause Failure
Common cause failure occurs when two or more components that are supposed to provide redundancy fail simultaneously due to a shared cause. These causes might include shared environmental factors (like temperature or humidity), a common power supply, or even human error. In SIL verification calculations, the beta factor (β) represents the portion of failure that cannot be assumed to be independent. Properly accounting for β is critical in ensuring that your redundant architecture isn’t giving a false sense of risk reduction. (Future article topic)
How Proof Testing is Done
Most proof testing is done with the process shutdown. That is the easy case. Suppose though testing is done when the process is operating and the the SIF is bypassed. In that moment it is bypassed, it is not available and your process is unprotected. All this impacts math.
How Diagnostics are Handled
Many or most SIFs have some sort of diagnostics. What does a facility do with a instrument in a 2oo3 that gets a diagnosed error. Does the SIF immediately trip? Does it go to reduced status and repaired? How fast? What about a safe failure versus a dangerous failure.
Support Systems
Many or most SIFs don’t need any supporting systems to activate. Meaning that with no air or no power they still work. However, some designs are a bit different and failed support systems can contribute.
Initial Failures
In some odd cases, a SIF can be commissioned without doing an initial full proof test. This would also be factored.
5. A Simple Example
Let’s say you have a single-channel SIF configured in a 1oo1 architecture, using an instrument that has a dangerous undetected failure rate of 1E-6 per hour. The system is proof tested every year (8,760 hours).

This value falls within the SIL 2 range as it corresponds to a Risk Reduction Factor (RRF) of 228.
Now, if you want to increase this to SIL 3, you will need to…
- Reduce the failure rate
- Reduce the TI
- Add redundancy by adjusting the architecture (which would use another equation)
- Increase diagnostic coverage
Note this formula is only valid for 1oo1 and a simple approach of doing these calculations.
6. How Design Choices Affect PFDavg
Designers can manipulate several variables to drive the value down:
- Shorter TI: More frequent testing catches failures earlier.
- Redundant architecture: 1oo2 or 2oo3 configurations use different equations.
- Better proof testing: Increases Cpt, reducing undetected failure exposure.
- Improved diagnostics: shifts the balance between the different failure rate terms
- Better components: Lower intrinsic failure rates (λD).
Each choice comes with trade-offs in cost, complexity, and operational downtime. The goal is to achieve just enough safety—not overdesign.
What About Voted Architectures Like 2oo3?
Redundant, voted architectures change the PFDavg equation. The one engineers ask about most is 2oo3 (two-out-of-three majority voting), common on critical trip systems. Its simplified PFDavg keeps the same independent-plus-common-cause shape:

Here λDU is the dangerous-undetected failure rate, TI the proof-test interval, and β the common-cause fraction. The independent (squared) term shrinks quickly with redundancy, so in practice the β common-cause term sets the floor on what a 2oo3 group can achieve — which is why getting β right matters more than simply adding channels. For the full 2oo3 worked example and a side-by-side with 1oo2, see our guide to applying the beta factor for common-cause failures.
In Summary
PFDavg is a key performance metric in functional safety for low-demand SIFs. It links directly to SIL and guides the engineering design and validation process. Understanding the basics of how it’s calculated—and what affects it—helps ensure you’re designing systems that meet the risk reduction targets set by IEC 61511.
Future articles will dive deeper into Cpt, MTTR, and β, each of which play roles in real-world SIL verification.
Frequently Asked Questions
What is the difference between PFDavg and PFH?
PFDavg applies to low-demand systems; PFH (Probability of Failure per Hour) applies to high/continuous-demand systems.
Can PFDavg be too low?
Yes. Overdesign increases cost and complexity without necessarily increasing safety proportionally.
Does IEC 61511 require PFDavg calculations?
Yes, for each SIF, PFDavg (or PFH) must be calculated to demonstrate compliance with the required SIL.
Is there a standard way to calculate it?
Yes and no. IEC 61508 and IEC 61511 provide methods and allow both simplified and detailed probabilistic approaches. But there are different levels of equations the engineer can choose to get into.
What determines what the PFDavg needs to be?
The required value is dictated by your hazard and risk assessment (H&RA)—typically performed through a Layer of Protection Analysis (LOPA). This is what tells you how much risk reduction is needed, which in turn defines your SIL target.
What role does proof testing play?
It reveals hidden failures. Generally speaking, the longer the proof test interval (TI), the higher the PFDavg.
Does the math formula change with different voting logic (e.g., 1oo2, 2oo3)?
Absolutely. The basic formula you’ve seen assumes a 1oo1 architecture. Different configurations use different math, and these differences can significantly change the resulting calculation.
Further Reading
From SIL Safe
External resources