
Every redundant safety instrumented function (SIF) calculation needs a beta factor (β), and the usual first source is the device’s safety manual or safety integrity level (SIL) certificate. That value is a starting point. It describes one device under conditions the vendor assumed, while the β in the average probability of failure on demand (PFDavg) calculation describes the redundant group you actually installed.
Beta factor estimation under IEC 61508-6 Annex D checks the vendor’s number against your installation. The documented check makes the number yours, and when the vendor β and the check disagree, the lower number needs the justification.
Think of Annex D as a design checklist first and a number generator second. Its value is the forced look at separation, procedures, training and environment. Its percentages are engineering judgment with no field data behind them (D.3).
What the Vendor’s β Describes
β is the fraction of a channel’s dangerous failures that take out every channel in the redundant group at once through common cause failure (CCF). It belongs to the redundant group as installed: shared or separate taps, the environment, the cable routes, and who calibrates which transmitter and when.

A low β says little about device quality or reliability. β is a fraction of λ, and the calculation uses β times the dangerous undetected failure rate, λDU (see how β enters the PFDavg calculation). Two transmitters show why:
- λDU = 2E-7/hr at β = 10% gives a common cause rate of 2E-8/hr.
- λDU = 2E-6/hr at β = 2% gives a common cause rate of 4E-8/hr, double the first despite the lower β.
The standards largely leave the final selection of β to the functional safety (FuSa) engineer. The failure calculation has to account for susceptibility to CCF, with “a justification of the assumptions made” (IEC 61508-2, 7.4.5.2 d). IEC 61511 repeats the requirement for the safety instrumented system (SIS) (11.9.2 f), and neither standard exempts certified devices. That’s why a vendor β doesn’t go into the math without further analysis.
Where Vendors Publish β
SIL certificates usually leave β off, and a vendor that publishes one more often puts it in the safety manual. β isn’t a required value for vendors: IEC 61508-2 doesn’t list it among the information a supplier provides for each element (7.4.9.4).
Published values come with conditions attached:
- Fisher V500 rotary valve safety manual – “a common cause factor of at least 5%” for redundant use, tied to the level of common cause training and maintenance at the user’s facility
- Endress+Hauser (E+H) Cerabar PMP71B functional safety manual – β of 5% for “homogeneously redundant use”, based on IEC 61508-6 Table D.4, with a note that a system-specific analysis can produce other values depending on the installation and any added components
- WIKA T32.xS temperature transmitter safety manual – no number; for two-channel operation it leaves beta factor estimation to the user under IEC 61508-6 Annex D
A vendor β is often an Annex D scoring done under assumed site conditions, and Table D.1 Note 1 tells the designer to make reasonable assumptions about operation and pass them to the eventual user.
The one place the vendor’s number is the final answer is redundancy inside a single safety programmable logic controller (PLC), where β is already in the published PFDavg. Redundancy the FuSa engineer configures across separate logic solvers or input/output (I/O) modules gets scored with Annex D in the logic subsystem column.
What β Covers and What It Leaves Out
Hardware Common Cause Only
Annex D limits its scope to common cause failures in hardware (D.2), so a firmware bug shared by three identical smart transmitters falls outside beta factor estimation. Systematic capability (SC) covers firmware, software and other design faults, while β covers hardware common cause, including what installation, environment and maintenance do to the hardware. Common mode failure is the subset of common cause in which the channels fail the same way.
Explicit and Implicit Common Cause
The Annex D β covers implicit common cause only. Implicit common cause is the kind that can’t be pinned on one shared component, such as one technician miscalibrating all three transmitters, or a shared vibration or temperature environment. It enters the calculation as β × λDU; at λDU = 2E-6/hr and β = 5%, that’s 1E-7/hr.
Explicit common cause is a specific shared component whose failure takes out every channel, such as a 24 VDC supply feeding all three transmitters of an energize-to-trip SIF. Instead of going into β, it gets its own failure rate and its own term in the model, which SIL Safe calls the support system term (PFDss). ISA TR84.00.02-2022 separates the two the same way and uses a shared power supply as its explicit example (5.2.3).
PFDss sits alongside β without double counting, because Annex D sends dependent failures with a clear, identifiable cause to conventional modeling (D.1.2). Double counting happens only when a device already inside a channel’s λ also goes into PFDss.
How Annex D Scores a Redundant Group
Beta factor estimation with Annex D works through its tables to get two numbers, X and Y, which add to a score, S, that sets β. Annex D scores instruments, the logic solver and final elements separately, since they face different environments and diagnostics (D.3).
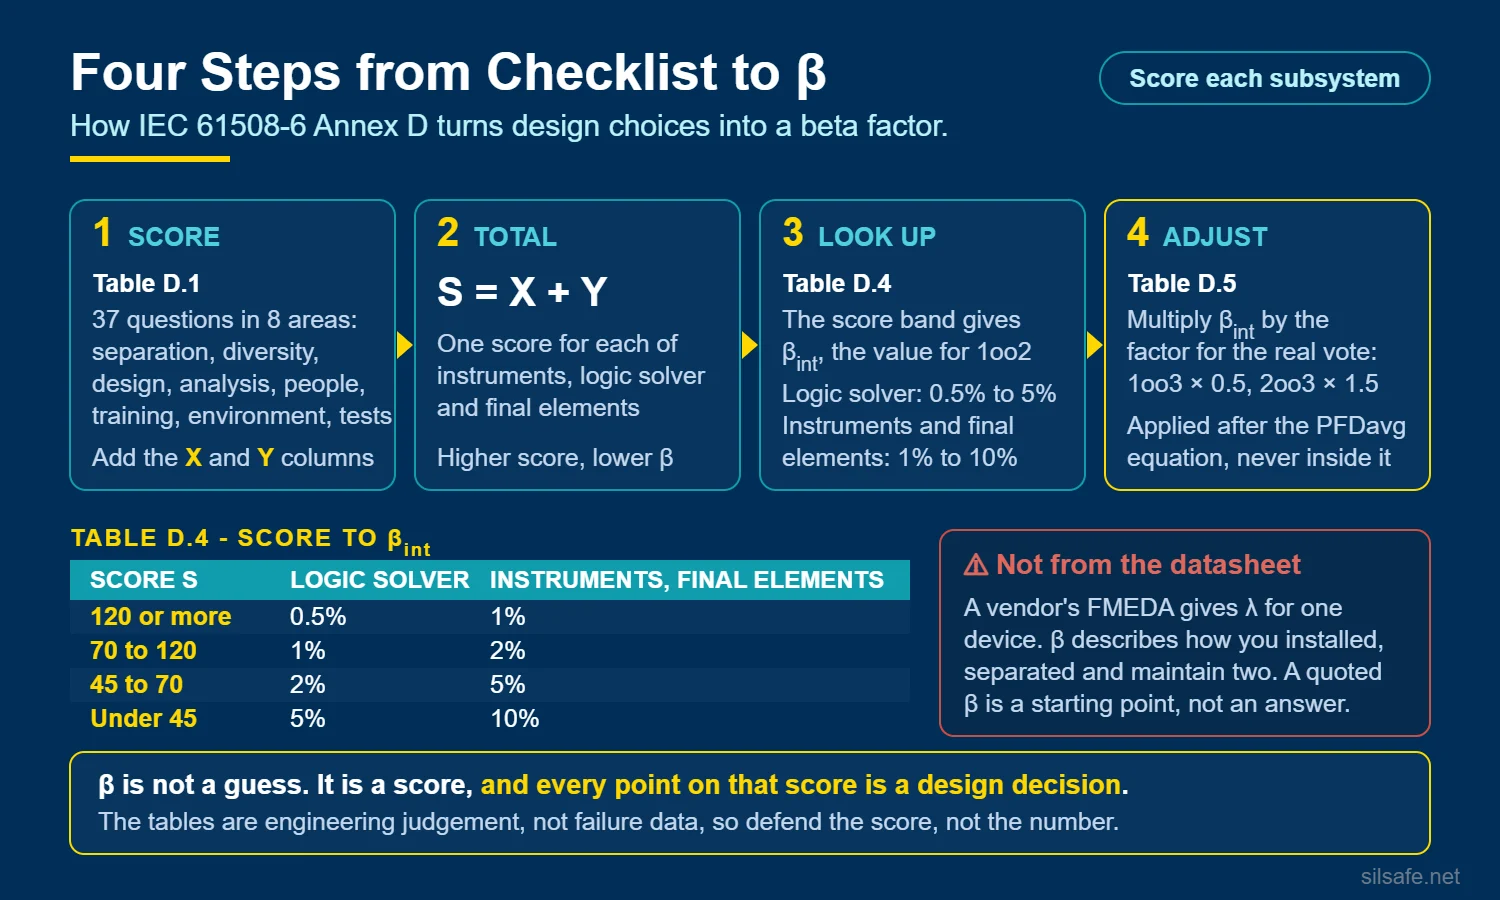
Table D.1 asks 37 yes-or-no questions in eight categories:
- separation/segregation
- diversity/redundancy
- complexity/design/application/maturity/experience
- assessment/analysis and feedback of data
- procedures/human interface
- competence/training/safety culture
- environmental control
- environmental testing
Each yes earns X and Y points:
- X – points for defenses that diagnostics make more effective
- Y – points for defenses that diagnostics don’t help
Each no earns zero points.
The table has a logic subsystem column and a sensors and final elements column, and location decides which one applies. A programmable electronic (PE) device, meaning one with a microprocessor such as a smart transmitter, scores in the logic subsystem column when it’s in the logic solver’s building. A device in the field scores in the sensors and final elements column (Tables D.2 and D.3, Note 3).
From Score to β
S = X + Y, and Table D.4 converts S to a 1oo2 β:
| Score S | Logic subsystem | Sensors and final elements |
|---|---|---|
| 120 or above | 0.5% | 1% |
| 70 to 120 | 1% | 2% |
| 45 to 70 | 2% | 5% |
| Below 45 | 5% | 10% |
The bands are coarse, so several real improvements can leave β unchanged while a single item moves it a full band. SINTEF’s review of the method points to the same weakness: the checklist responds only weakly to individual changes.
Annex D also has a Z factor that gives detected failures a lower β when diagnostics catch a common cause, such as a failed cooling fan, in the first channel and the system acts before it reaches the second. The credit counts only when the system responds to a detected failure by going to a safe state or repairing it inside the claimed interval (Tables D.2 and D.3, Note 4), and a logic subsystem in a plant that keeps running on a detected fault earns none (Note 5). SIL Safe leaves Z out of its PFDavg calculations.
The Architecture Multiplier Is a Separate Step
Tables D.1 through D.4 produce a β for a 1oo2 group, and a vendor β is also a 1oo2 value. Table D.5 is a separate step that scales the 1oo2 β to the architecture actually installed:
| Architecture | Table D.5 multiplier |
|---|---|
| 1oo2 | 1.0 |
| 1oo3 | 0.5 |
| 2oo3 | 1.5 |
| 1oo4 | 0.3 |
| 2oo4 | 0.6 |
| 3oo4 | 1.75 |
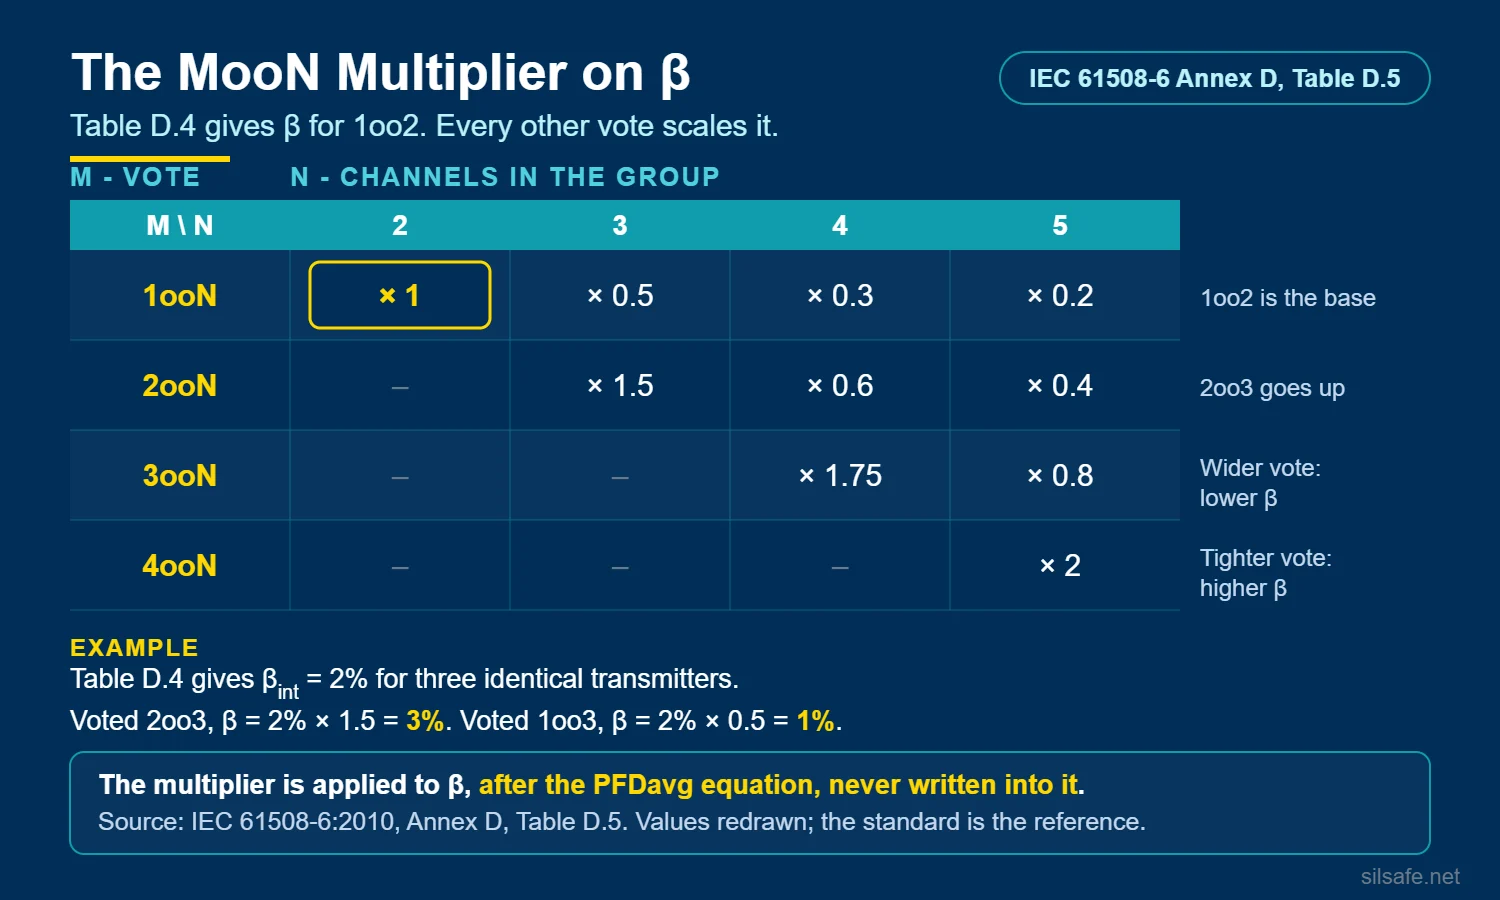
The multiplier applies the same way whether the 1oo2 β came from the vendor, an Annex D score or plant data.
NooN architectures such as 2oo2 have no Table D.5 entry, because any single channel failure already fails the group and β drops out of their PFDavg. That missing entry covers PFDavg only. NooN groups still carry a β term in the spurious trip rate, so the two shouldn’t be confused.
This step is a frequent point of confusion. SIL Safe applies the multiplier to β before working the numbers, and the PFDavg equations stay in their base form.
Why the Vendor’s β Is Not the Whole Story
The sensors and final elements columns offer 101.5 total points, and by our count the device vendor controls about a third of them:
| Who controls it | Points | Examples |
|---|---|---|
| Device vendor | 32 | environmental immunity testing, field failure feedback into the design, I/O protection, diagnostics that report to a replaceable module |
| Vendor and site together | 7 | operation within the tested environment, more than 5 years’ experience with the hardware |
| FuSa engineer | 31.5 | diverse sensing principles or designs, CCF training for designers, CCF considered in design reviews and in the failure modes and effects analysis (FMEA) or fault tree of the group, separate electronics per channel |
| Site installation, operation and maintenance | 31 | cable routing, staggered calibration by different technicians, CCF training for maintainers, limited access |
The vendor’s items score 32 and the shared items bring that to 39, both under 45, so a device scored on its own merits lands at β = 10%. Any vendor β below 10% has already assumed points from the FuSa engineer or the site, and only the user can confirm those assumptions hold.
Operating experience shows higher β values than vendors publish, and higher than Annex D’s ceiling. SINTEF’s 2015 field study, later cited in the PDS Data Handbook as the basis for its updated β values, reviewed some 12,000 maintenance notifications from six Norwegian offshore facilities. It suggests generic β values of 15% for process transmitters and 12% for emergency shutdown valves, against Annex D’s 10% maximum for instruments and final elements.
The gap is partly by design. Annex D says its maximum values are “lower than would normally be used,” because they assume the rest of IEC 61508’s systematic failure measures are in place (Table D.4, Note 1), while field data includes calibration, installation and design errors.
The FuSa Engineer’s Overall β Process
In practice, beta factor estimation comes down to a handful of rules:
- The FuSa engineer works through the X, Y and S steps once for each installation typical, such as a standard transmitter installation or a standard valve assembly, and each SIF calculation references the typical.
- Of the vendor β and the Annex D β, the higher 1oo2 value goes into the calculation.
- The lower number goes in only when you can name the vendor’s assumption your installation beats, or when plant common cause data supports it. Annex D accepts data-backed methods (D.1.1), and ISA TR84.00.02-2022 selects β “based on prior-use data in the operating environment.”
- Generic field data, such as the PDS Data Handbook values, serves as a cross-check. A score well below it holds only if the site actually runs the procedures it credited, and where the site can’t show those procedures in practice, the generic value is the defensible choice.
- Where the vendor publishes no β, the Annex D score is the β.
- β and its basis go into the safety requirements specification (SRS) and the calculation basis, since IEC 61511 requires reliability data that is “credible, traceable, documented, justified” (11.9.3).
Five Worked Examples
All five examples run beta factor estimation against one set of site practices, so the differences come from the devices and where they’re installed. Each example states whether its devices have diagnostics, which earn their own Table D.1 points. Example 2 is the deep dive, scored item by item; the other four give the totals and what changes from Example 2.
Example 1: Everything 1oo1
One smart pressure transmitter, one safety PLC in the control building, and one final element with a single solenoid in its top hat make up the SIF.
Diagnostics – the smart transmitter has them, but nothing is redundant, so there’s no β to score.
Conclusion – no β enters the calculation, and Table D.5 has nothing to scale.
Example 2: 2oo3 Smart Transmitters in the Field
Three SIL-certified smart pressure transmitters of the same model vote 2oo3, each on its own tap on outdoor pipework, cabled to a safety PLC in the control building. The safety manual gives β = 5%.
Separate taps earn no Table D.1 points, but they mean no shared tap needs its own common cause term in the model. The group scores in the sensors and final elements column, since the transmitters are PE-based but outside the PLC’s building.
Diagnostics – yes. Each transmitter’s self-diagnostics report failures to the level of a replaceable module, which earns that Table D.1 item.
Scoring the Installation
This site answers every Table D.1 item in the sensors and final elements column. The item wording is shortened here; the exact wording is in Table D.1 of IEC 61508-6. A yes earns the item’s X and Y points and a no scores zero, so only the yes rows add to the total:
| Item | This site | X / Y | Controlled by |
|---|---|---|---|
| Separation / segregation | |||
| Signal cables for each channel routed separately everywhere | No – the three share a multicore for part of the route | 0 / 0 | Site |
| Each channel’s electronics on its own circuit boards | Yes – three separate transmitters | 2.5 / 1.5 | FuSa engineer |
| Each channel’s electronics indoors in separate cabinets | No – field-mounted on outdoor pipework | 0 / 0 | Site |
| Diversity / redundancy | |||
| Different physical sensing principles | No – three pressure transmitters | 0 / 0 | FuSa engineer |
| Different electrical designs or manufacturers | No – same model | 0 / 0 | FuSa engineer |
| Separate test methods and people for each channel at commissioning | No – one crew, one procedure | 0 / 0 | Site |
| Maintenance on each channel by different people at different times | No – one technician, same day | 0 / 0 | Site |
| Complexity / design / application / maturity / experience | |||
| Channels exchange nothing beyond diagnostics or voting | Yes – independent 4-20 mA loops | 0.5 / 0.5 | FuSa engineer |
| Design based on techniques proven in the field for more than 5 years | Yes | 1.0 / 1.0 | Vendor |
| More than 5 years’ experience with the same hardware in similar service | Yes – model on the market for more than 5 years | 1.5 / 1.5 | Vendor and site |
| Inputs and outputs protected from over-voltage and over-current | Yes | 1.5 / 0.5 | Vendor |
| Components conservatively rated, by a factor of 2 or more | No – the safety manual doesn’t say | 0 / 0 | Vendor |
| Assessment / analysis and feedback of data | |||
| FMEA or fault tree of the group examined for CCF sources | No – never done | 0 / 0 | FuSa engineer |
| CCF considered in design reviews and fed back into the design | No | 0 / 0 | FuSa engineer |
| Field failures fully analyzed with feedback into the design | Yes – the vendor’s certified process | 0.5 / 3.5 | Vendor |
| Procedures / human interface | |||
| Written system to find the root cause of every failure and inspect similar items | No | 0 / 0 | Site |
| Maintenance staggered across channels, with diagnostics run between them | No | 0 / 0 | Site |
| Procedures forbid relocating parts of redundant channels | No | 0 / 0 | Site |
| Repairs done off-site at a qualified repair center, with full testing before reinstallation | Yes – failed units go back to the manufacturer | 0.5 / 1.5 | Site |
| Diagnostics report failures to the level of a replaceable module | Yes | 1.0 / 1.0 | Vendor |
| Competence / training / safety culture | |||
| Designers trained in the causes and consequences of CCF | No | 0 / 0 | FuSa engineer |
| Maintainers trained in the causes and consequences of CCF | No | 0 / 0 | Site |
| Environmental control | |||
| Personnel access limited | No – open pipework | 0 / 0 | Site |
| Operates within its tested environmental range without added environmental control | Yes – no enclosure heaters or sunshades needed | 3.0 / 1.0 | Vendor and site |
| Signal and power cables separate at all positions | Yes – routing drawings show instrument and power trays apart end to end | 2.0 / 1.0 | Site |
| Environmental testing | |||
| Tested to recognized standards for electromagnetic compatibility (EMC) and for immunity to temperature, vibration, shock and humidity | Yes – certified | 10.0 / 10.0 | Vendor |
| Total | 24.0 / 23.0 |
X = 24.0 and Y = 23.0, so S = 24 + 23 = 47. That falls in Table D.4’s 45 to 70 band for sensors and final elements, so β = 5%, which matches the safety manual and now has a documented basis.
Where the Points Come From
Of the 47 points, 37 come from the device, the vendor’s processes and two items shared with the site. Environmental immunity testing alone supplies 20.
The FuSa engineer and the site earn the other 10 points, and the FuSa engineer’s 5 come free with the design: three separate transmitters and independent 4-20 mA loops. The only deliberate site defenses are off-site repair and signal and power cables run apart, worth 5 points together.
The device needed 8 more points to reach the 5% band, and the FuSa engineer and the site found 10, so the safety manual’s 5% holds with 2 points to spare. Diversity and competence score zero, under Annex D’s recommended minimum of one-twentieth of the total for each category (Tables D.2 and D.3, Note 1), so the score leans on the vendor’s side of the table.
Applying the Architecture Multiplier
The 5% β is a 1oo2 value, and the Table D.5 multiplier for 2oo3 takes it to 7.5%.
What Would Change the Answer
- Running power and signal cables together drops S to 44 and β to 10%.
- Fixing the biggest real weakness at this site, one technician calibrating all three transmitters, doesn’t move β. Staggered maintenance by different people adds 6 points, and S = 53 is still in the 5% band.
- Reaching 2% takes a full common cause program: staggered maintenance by different people, separate cable routes, CCF training, documented procedures and CCF in design reviews, which together bring S to 72.
- No group in the sensors and final elements column can go below 2%, since the whole column totals 101.5 points and 1% takes 120.
Conclusion
The 2oo3 calculation for this SIF uses β = 7.5%. The safety manual’s 5% holds on the score, and the calculation basis records the score’s two weak spots: diversity and competence fall below Annex D’s recommended category minimum, and one technician calibrating all three transmitters lets one calibration error reach all three.
Example 3: 2oo3 Analog Transmitters in the Field
The installation matches Example 2, with three 1985-vintage analog pressure transmitters that have no microprocessor and no certificate. The group scores in the sensors and final elements column, and the column rule in Tables D.2 and D.3, Note 3 doesn’t apply, since the devices aren’t PE-based.
Diagnostics – no, so the diagnostics item scores zero.
With no certificate or test evidence on file for a 1985 design, environmental immunity testing, operation within the tested environmental range and the vendor’s field failure feedback also score zero. X = 9.5 and Y = 7.5 give S = 17 and β = 10%. The 28 points lost to missing test evidence and feedback drive that drop far more than the 2 missing diagnostics points.
Conclusion – with no vendor β to compare, the Annex D score is the β, and after the 2oo3 multiplier the calculation uses β = 15%.
Example 4: 2oo3 Smart Transmitters in the PLC’s Building
Three thermocouples in the field each wire to their own DIN-rail smart temperature transmitter, mounted in a marshalling cabinet in the rack room that also houses the safety PLC’s cabinet. The transmitter safety manual gives no β.
The transmitters score in the logic subsystem column, because Tables D.2 and D.3, Note 3 puts PE-based devices in the logic solver’s building there. That note is a common error point, since teams tend to score a smart transmitter as a field instrument wherever it’s mounted. The thermocouples aren’t PE-based, are in the field, and score as their own group in the sensors and final elements column.
Diagnostics – yes. Coverage of 60% to 90%, reported to a replaceable module, earns its Table D.1 item in the logic subsystem column.
The site practices match Example 2. The rack room adds limited access, all three transmitters share one cabinet, and each transmitter has one input and one output, which earns the simple system credit. With several of Example 2’s items worth less in the logic subsystem column, X = 23.5 and Y = 24.5 give S = 48, so β = 2% from the logic subsystem band. The same score in the sensors and final elements column gives 5%.
Conclusion – with no safety manual value to compare, the score is the β, and after the 2oo3 multiplier the calculation uses β = 3% for the transmitters only.
Example 5: 1oo2 Solenoids on One Final Element
One smart pressure transmitter, one safety PLC and one final element make up the SIF, with two SIL-certified solenoids in series in the top hat of the final element. Either solenoid trips it, the common 1oo2 safety arrangement, and the solenoid safety manual gives β = 5%. β applies to the solenoid pair only, scored in the sensors and final elements column; the rest of the final element is 1oo1 and has no β.
Diagnostics – no. Solenoids have none, so the diagnostics item scores zero.
The site practices match Example 2. The solenoids have no electronics and get rebuilt in the site shop, so they also lose the separate electronics, I/O protection and off-site repair credits. X = 18.5 and Y = 18.5 give S = 37 and β = 10%.
Conclusion – the score’s 10% is higher than the safety manual’s 5%, so it goes into the calculation. With the Table D.5 multiplier of 1.0 for 1oo2, the solenoid pair uses β = 10%.
Results Across the Examples
| Example | Diagnostics | Safety manual β | Annex D β | β after Table D.5 |
|---|---|---|---|---|
| 1 – Everything 1oo1 | Yes, but no redundancy | n/a | none | none |
| 2 – 2oo3 smart transmitters in the field | Yes | 5% | 5% | 7.5% |
| 3 – 2oo3 analog transmitters | No | none – no certificate | 10% | 15% |
| 4 – 2oo3 smart transmitters in the PLC’s building | Yes | none given | 2% | 3% |
| 5 – 1oo2 solenoids | No | 5% | 10% | 10% |
Diagnostics change β only through Table D.1’s diagnostics items, worth 2 points in the sensors and final elements column and 0.5 to 4 in the logic subsystem column. Removing them leaves Examples 2 and 4 in the same band.
Life-cycle Placement
Before beta factor estimation, the hazard and risk assessment (H&RA) and SIL allocation set each SIF’s target.
The design process starts with selecting components and assessing architectures, and beta factor estimation runs inside that loop:
- Pick the components.
- Try an architecture.
- Estimate β.
- Check at SIL verification whether the SIF meets its requirements.
- Adjust and iterate.
The process goes back and forth far more often than it runs in a straight line. Detailed design follows once the components, architecture and β meet the requirements.
Beta factor estimation repeats for the life of the SIS. A management of change that touches the group, such as a new device model, rerouted cables or a change in who calibrates, triggers a rescore, and common cause failures that turn up in proof tests or failure records feed back into the number.
Common Mistakes With Respect to Common Cause Failure
Teams copy the vendor β without checking how the group gets maintained. One technician calibrates all three level transmitters on a vessel the same morning, with the same reference. One calibration error lands in all three, and the 2oo3 vote agrees with itself and is wrong. SINTEF found this coupling in operating data, where “the same operator calibrates all level transmitters mounted on the same vessel.”
Other mistakes to watch for:
- The Table D.5 multiplier gets applied to a β that already includes it, or gets skipped.
- Teams pick the Table D.1 column by device type, though Tables D.2 and D.3, Note 3 sets it by where a PE-based device is installed, and the logic subsystem column turns the same score into a lower β.
- Teams take credit for procedures that exist only on paper, such as staggered calibration or CCF training, though Table D.1’s operating items are commitments the site keeps for the life of the SIS (Table D.1, Note 1).
Frequently Asked Questions
The safety manual for my 2oo3 transmitters lists β = 5%. Is that the β for my calculation, or do I have to run the Annex D scoring?
Run the scoring. The 5% is the vendor’s 1oo2 number under conditions they assumed, and your calculation needs a β for your installation. Score Table D.1 once for your standard transmitter installation, compare the result with the 5%, and use the higher of the two. Then apply the 2oo3 multiplier, so a 5% that survives the scoring goes into the calculation as 7.5%.
I calculated β with Annex D for my PFDavg. Do I also use that number in my spurious trip rate calculation?
Yes. The coupling Annex D scores, a shared environment, one technician, identical designs, doesn’t care whether the failure it causes is safe or dangerous, so the usual practice is one β for both. It matters most where more than one channel has to fail before the SIF trips spuriously, such as 2oo2 and 2oo3. In 1oo2, any single safe failure trips the SIF anyway, so β barely moves its spurious trip rate.
Does running Annex D usually give me a higher or lower β than the vendor’s number?
It depends on your site. For devices in the field, most vendors publish 2% to 5%. Beta factor estimation at a site without a common cause program scores the same or higher, 5% to 10%, and only a site with documented separation, staggered maintenance and CCF training earns 2%. Against the 10% default many calculations use without any scoring, the Annex D result usually comes out lower.
Annex D keeps talking about βD and a Z factor for diagnostics. Do I need those?
No. Process industry practitioners generally leave βD and the Z factor out. The credit depends on the system going to a safe state or repairing every detected failure in time, which many installations don’t do, and SIL Safe’s PFDavg equations leave them out as well.
Can I run Annex D on two shutdown valves in series? Half the checklist is about circuit boards.
Yes, in the sensors and final elements column. The electronics items score zero for a mechanical valve, so a valve pair usually lands near Example 5’s 10% unless the site’s procedures earn points back. The site items that help most are maintenance staggered across the two valves by different people, CCF training for maintainers and a written root cause system for every failure.
There’s a note in Annex D about every category contributing one-twentieth of the score. Is that something my score has to pass?
No. It’s a recommended balance check that flags a score leaning on one or two categories, and β still comes straight from Table D.4. If a category falls short, record it in the calculation basis as a weak spot, the way Example 2 records diversity and competence. Closing the gap doesn’t need a band change either: in Example 2, CCF training for maintainers and maintenance by different people add 8 points, clear the one-twentieth mark in every category at S = 55, and leave β at 5%.
Further Reading
From SIL Safe
- How to Apply the Beta Factor: A Practical Guide to Common Cause Failures in SIL Verification
- 2oo3 Architecture: The Design Decision Behind Majority Voting
- SIL Verification: The Three Gates Every SIF Must Clear
- Where Does the Data Come From? A Guide to Failure Rate Data Sources in Functional Safety
- Spurious Trip Rate Explained: 6 Facts Every Functional Safety Engineer Should Know
External resources