
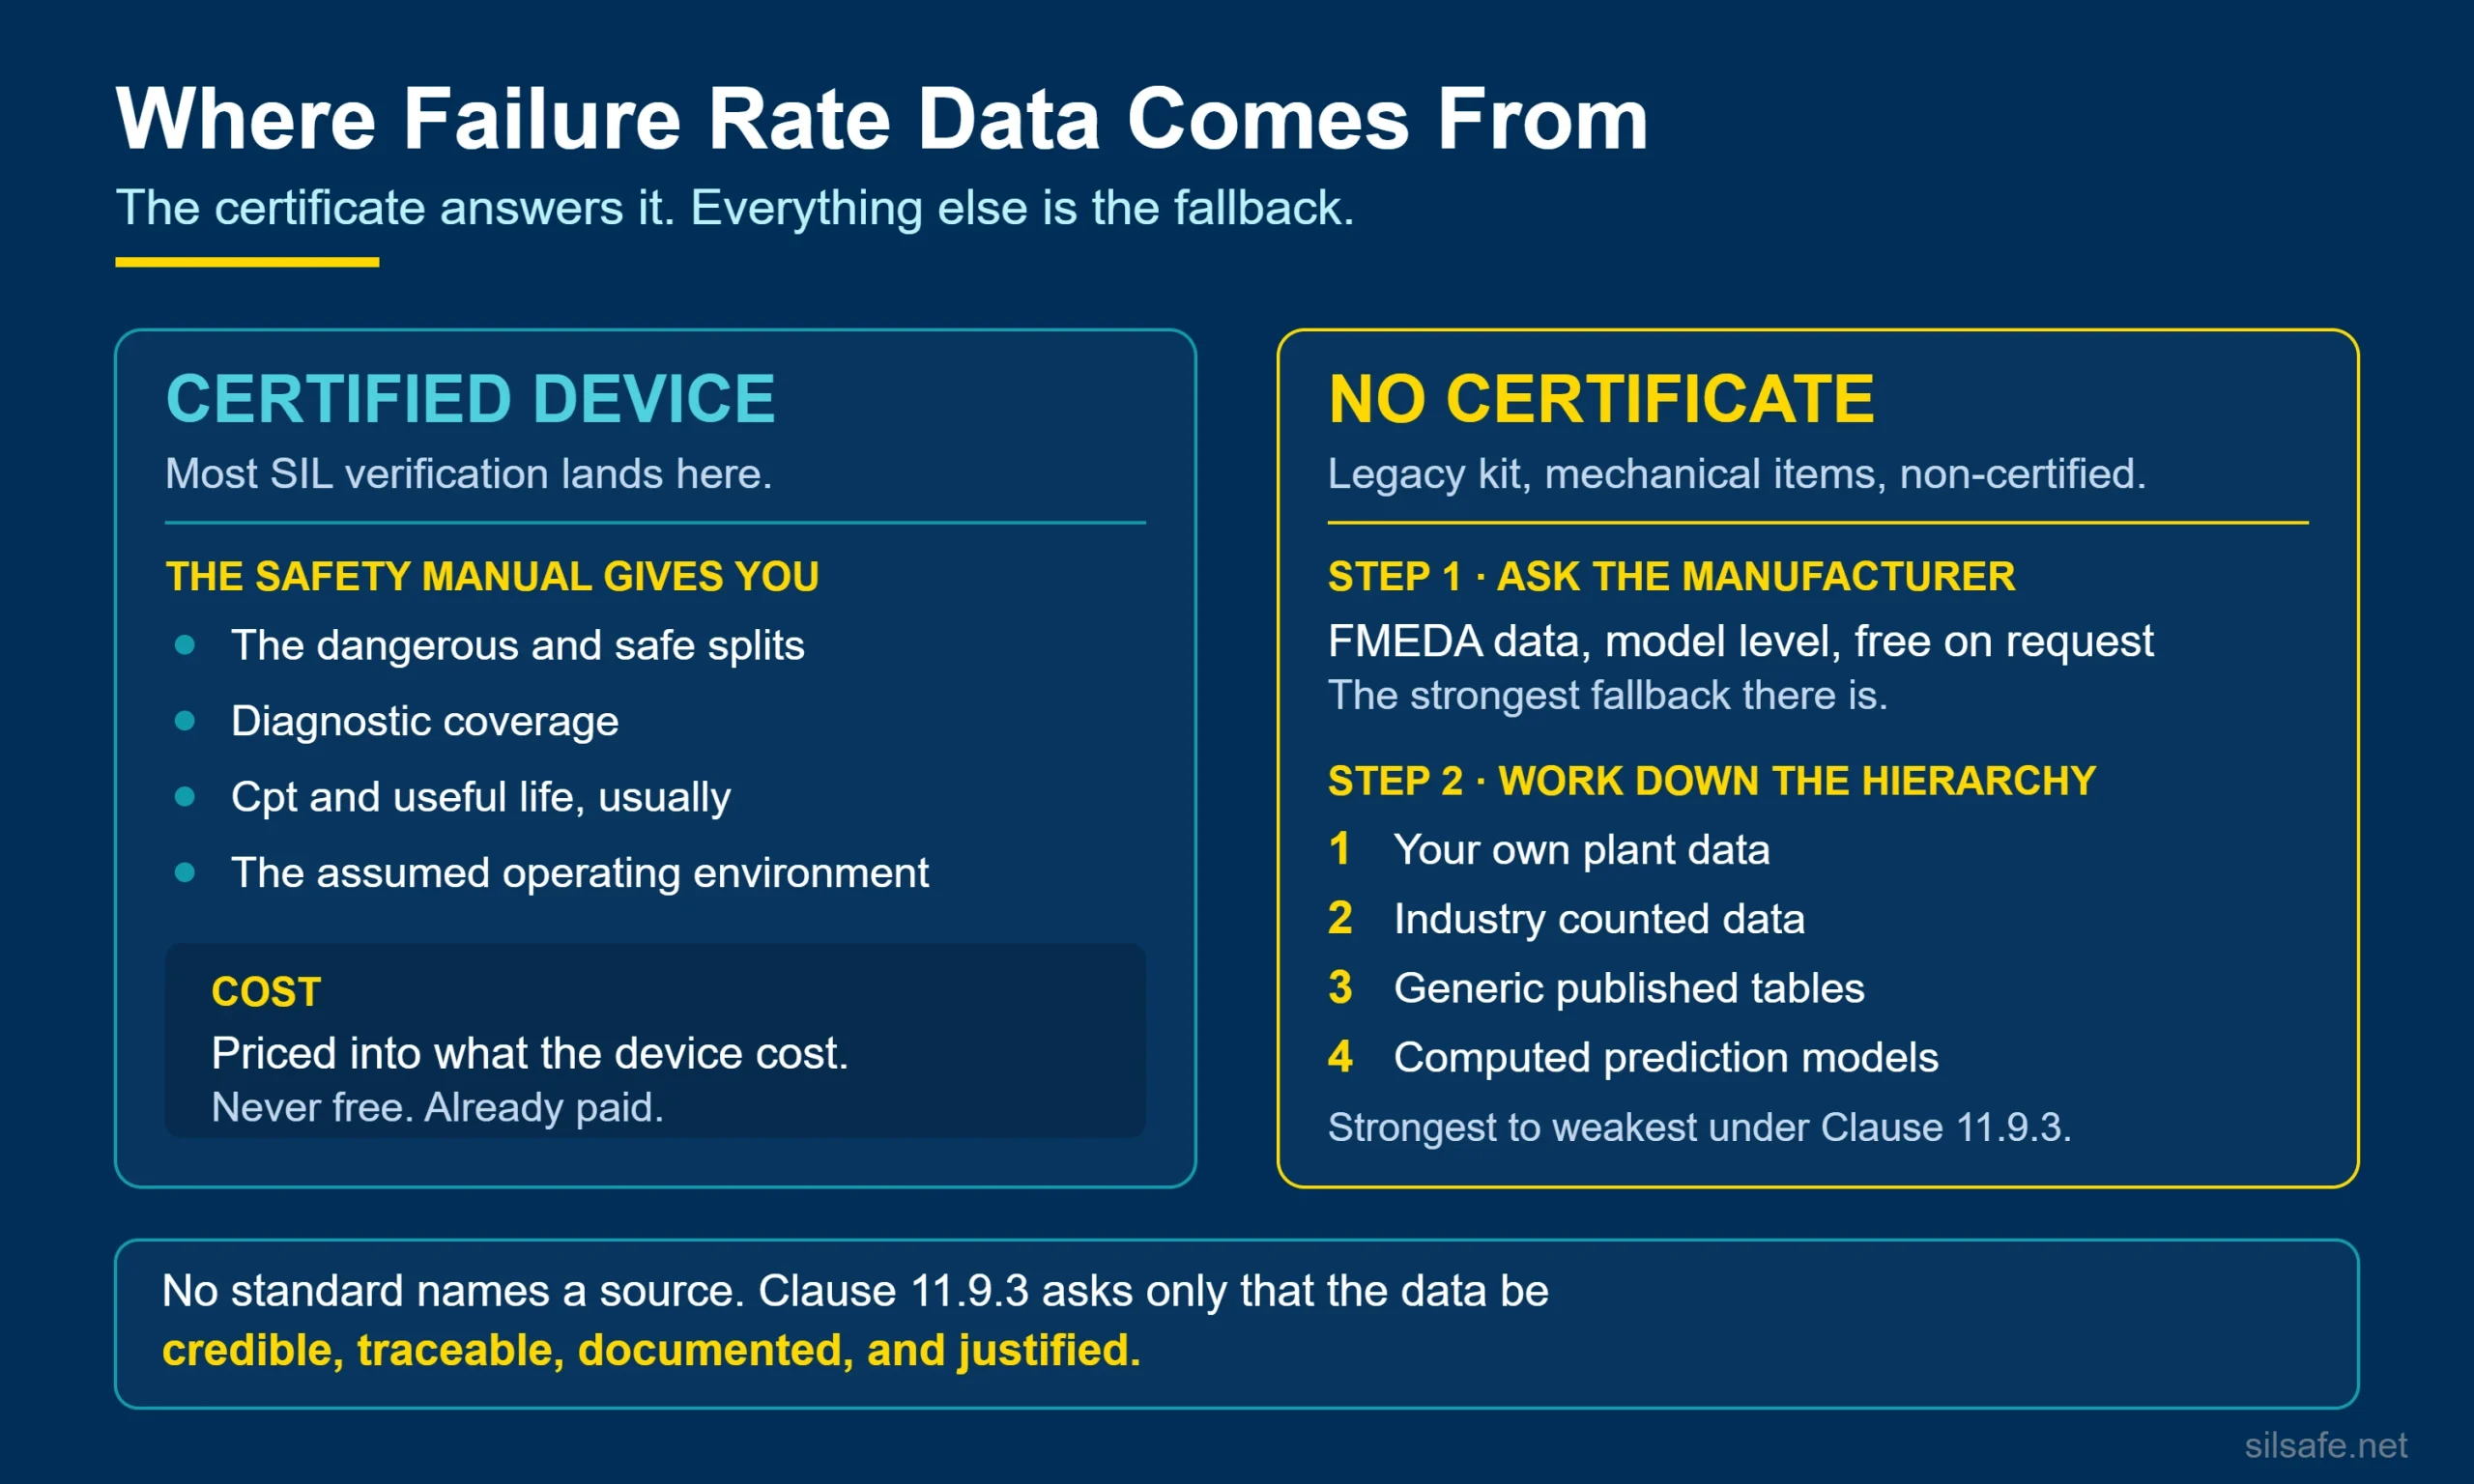
For most safety integrity level (SIL) verification work today, the failure rate data question is already answered. The SIL certificate and the product safety manual supply the failure rates, the dangerous undetected and dangerous detected split (λDU and λDD), the diagnostic coverage, and often proof test coverage (Cpt) and useful life, all in one package.
That failure rate data comes with the device. There is no separate purchase and no database to search. It is not free in any real sense, since the certification work is priced into what the device cost.
Finding failure rate data becomes a real job only when there is no certificate to read. That happens with legacy equipment, with non-certified mechanical items, when a facility justifies a device on its own operating history, and for the manufacturers generating the data behind a certificate in the first place.
Engineering has produced enormous quantities of excellent reliability data, and most of it was built to answer a different question. Pipeline leak frequencies and flange rupture rates are sound numbers aimed at the initiating event. Only a subset of published reliability data is even potentially relevant to SIL verification, and much of that subset falls away on inspection: wrong failure mode, no dangerous and safe split, no proof test basis, wrong service. Sources of failure rate data are not interchangeable.
Nothing in IEC 61511 or IEC 61508 mandates a specific source. Clause 11.9.3 asks that reliability data be credible, traceable, documented, and justified. Practitioners have clear favorites anyway, and the order the sources appear in below reflects that.
Three separate questions hide inside a request for failure rate data: failure rates, common cause failure (CCF) data, and proof test coverage. The sources thin out sharply from the first to the third.
How the Sources Differ
Three properties decide how much weight a piece of failure rate data carries.
- Granularity. Manufacturer model level failure rate data comes from one place, the manufacturer’s own failure modes, effects and diagnostic analysis (FMEDA) and the certificate built on it. Every other source reports by component type, and component type data carries an assumption with it: that your device is typical of its class.
- Provenance. Counted failure rate data comes from observing failures in a population and dividing by exposure, either in service or on a test rig. Computed data comes from modeling the rate through part counts, stress factors, or a failure mode analysis of the design. Both are legitimate. IEC 61511 Clause 11.9.3 asks for field feedback from similar devices in a similar operating environment, and a computed number answers that less directly.
- Vintage. Almost every failure rate data source here has been renamed, superseded, frozen, withdrawn, or handed to a different organization, and several are still cited under names that no longer exist. Record the edition and the date, or the calculation cannot be reproduced.
Failure Rate Data: Process Industry Sources
These are the failure rate data sources a process industry practitioner actually reaches for, ordered roughly by how often they get used in SIL Safe’s experience.
Plant Data
Your own site maintenance records are failure rate data, and IEC 61511 Clause 11.5.3 provides the prior use path that lets a facility justify a device on its own operating history.
The obstacle is the gap between what a computerized maintenance management system (CMMS) captures and what the calculation needs. An average probability of failure on demand (PFDavg) calculation needs run hours, demand counts, and a dangerous or safe call on every failure. A system built to close work orders rarely records any of the three in a usable form.
Goble’s caution applies throughout. Plant failure rate data is usable only where there is confidence that every failure was reported, because missed failures make the rate optimistic by an unknown amount.
The compliance routes that consume this evidence are covered in SIL Verification: The Three Gates.
Granularity here is finer than model level, since this is your device, in your service, at your site. Provenance is counted, in your own operating conditions.
OREDA
Offshore and Onshore Reliability Data (OREDA) is failure rate data collected since the early 1980s by a consortium of oil and gas operating companies. The Norwegian research organization SINTEF performs the analysis and the certification body DNV distributes the handbook.
The current public edition is OREDA 2015, the 6th, published in two volumes covering topside and subsea equipment. Access to the underlying database runs through consortium membership, held by the operating companies that fund the work and contribute the failure records.
Granularity is component type, spanning all offshore equipment, with safety instrumented system (SIS) devices forming one part of a much wider scope. Provenance is counted, from failures and operating hours on real installations. Cost sits in the mid band, roughly USD 370 per volume or USD 550 for both.
The PDS Data Handbook
Reliability Data for Safety Equipment is SINTEF’s handbook, current edition 2021, in a series running since the 1980s. PDS is a Norwegian acronym for the reliability of safety instrumented systems.
It draws on the same analyst and largely the same Norwegian continental shelf experience as OREDA, aimed at a different job. OREDA reports how often equipment failed. PDS reports what a safety instrumented system needs from failure rate data:
- dangerous undetected, dangerous detected, and safe splits
- safe failure fraction (SFF) and diagnostic coverage
- beta factor (β) values per device category
OREDA gives a rate with no dangerous fraction, and failure rate data without that split cannot go into a PFDavg calculation. That, along with the β values, is why PDS stays in use.
Granularity is component type and provenance is counted. Cost sits in the mid band, roughly USD 690 through SINTEF, with sample pages free and an electronic subscription sold separately.
Textbooks and References With Data Tables
Published books are legitimate, auditable sources of failure rate data, and often sufficient for a defensible calculation.
- Goble and Cheddie, Safety Instrumented Systems Verification: Practical Probabilistic Calculations (ISA, 2005), carries failure rate data tables for relays, logic solvers, and typical safety instrumented function (SIF) devices, plus the β and Cpt values its worked examples run on.
- Smith, Reliability, Maintainability and Risk, 10th edition 2021, and the FARADIP.THREE database behind it, give failure rate ranges across industries, with the range treated as the answer.
- Smith and Simpson, The Safety Critical Systems Handbook, 5th edition 2020, gives data hierarchy guidance alongside generic ranges.
Granularity is component type. Provenance is mixed, since these titles compile counted and computed sources alike, which makes the edition you cite the thing that matters. Cost is low band per title.
The Manufacturer’s FMEDA Data
A device can carry no certificate and still have an FMEDA behind it. Manufacturers run the analysis for internal design work, because a large customer asked for it, or as preparation for a certification that never happened. None of those reasons makes the failure rate data any less valid.
The analysis is developed and maintained by the manufacturer’s engineering and quality departments, and it is built on the actual design, with a parts list, failure modes, and diagnostic claims. That makes it the strongest fallback in this article, model level failure rate data produced by the people who built the device.
It is worth asking. An assessed device comes with its FMEDA data at no additional charge, and if the manufacturer cannot produce it, that answer is itself information about the device.
Check that the data matches your exact model and revision. Manufacturers revise designs without reissuing the analysis.
Granularity is manufacturer model, which is the finest available short of your own plant data. Provenance is computed, from the failure mode analysis of the design. Cost is free on request.
SILSafeData
SILSafeData is free from exida. It publishes failure rate data as upper and lower λDU bounds by device category and application, pooled from the same FMEDA work behind exida’s certification and assessment projects.
A plant data rate or a generic table entry arrives with no independent way to know whether it is credible. Those bounds are that check, and a number outside them needs an explanation before it goes into the calculation. The same screen catches an implausibly low λDU in a supplier’s claimed rate.
The age of the underlying failure rate data is not stated anywhere on the site, which is worth knowing before leaning on it as anything more than a screen.
Granularity is device category and application. Provenance is computed, from the same FMEDA foundation. Cost is free with registration.
PERD and the CCPS Guidelines
Two forms of one lineage come from the Center for Chemical Process Safety (CCPS) at the American Institute of Chemical Engineers (AIChE), which is why they get confused with each other.
The book came first. Guidelines for Process Equipment Reliability Data, 1989, is a set of static failure rate data tables, dated but still cited, and the oldest lineage in the process industry set.
The Process Equipment Reliability Database (PERD) is the successor, and it took a different form: a taxonomy plus a live contributed database. CCPS still owns the taxonomy and the publications, and the software is now operated privately by Reliability Dynamics.
Granularity is component type. Provenance is counted, contributed by participating chemical plants, with a process equipment focus. Cost is low band for the book. The database has no published price and access is arranged directly with Reliability Dynamics, so treat it as subscription only.
Failure Rate Data: Sources From Other Industries
No rule in the functional safety standards restricts failure rate data to process industry sources. Any source that survives the credible, traceable, documented, and justified test is usable.
Nuclear
Two documents carry almost all of the nuclear failure rate data that is useful outside nuclear, and both are free.
NUREG/CR-6928 was first issued in 2007 and most recently updated against 2006 to 2020 data. It gives industry-average component failure rates and initiating event frequencies for the US commercial fleet, published by the US Nuclear Regulatory Commission (NRC), with updates posted on the Idaho National Laboratory operating experience site.
NUREG/CR-5497, October 1998, with annual parameter estimation updates since, gives common cause failure parameter estimates by component type.
Both are free because US nuclear regulation runs on probabilistic risk assessment (PRA), known outside the US as probabilistic safety assessment (PSA). That makes the supporting data public record.
Granularity is component type, and the device classes map directly onto SIF hardware: motor-operated valves, air-operated valves, solenoid valves, pumps, transmitters, and relays. Provenance is counted, from licensee event reports and plant records. Cost is free.
Electronics and Telecom
The Quanterion databooks are counted field failure rate data rather than prediction models, and they are accessed together through the Reliability Online Automated Databook System (ROADS) subscription at roughly USD 800 per user per year.
- Nonelectronic Parts Reliability Data (NPRD-2023) covers the mechanical and electromechanical parts that carry no certificates.
- Electronic Parts Reliability Data (EPRD-2024) covers electronic components.
- Failure Mode/Mechanism Distributions (FMD-2016) is one of the few published answers to the safe versus dangerous split question.
Telcordia SR-332 and Siemens SN 29500 both carry a quote wall. Neither publishes a price, so you cannot see what a copy costs until you contact the publisher.
Telcordia SR-332, Issue 4, March 2016, is still current. It descended from Bellcore and now sits with Ericsson. The ordering row reads “PDF, click to request price quote.” Section 8 carries generic device failure rates and Section 9 the environmental factors.
Siemens SN 29500 is a works standard with no reseller. You have to request a quote from Siemens AG Standards Information in Munich, and what arrives is a name-stamped bilingual German and English PDF licensed to one named user.
Both sit at the electronic component level inside a device, where the failure rate data work belongs to the manufacturer.
Granularity is generic part type. Provenance is counted for the Quanterion databooks and computed for the prediction standards.
The US Navy Mechanical Handbook
NSWC-11 is the Naval Surface Warfare Center Carderock Division Handbook of Reliability Prediction Procedures for Mechanical Equipment. The number is the year, so NSWC-11 is the 2011 revision of a series reissued since the 1990s. It is a research product with no standards status.
It covers valves, actuators, springs, seals, and bearings, which is where certified failure rate data runs out, since mechanical parts rarely carry SIL certificates.
Granularity is generic component type. Provenance is computed, from material properties, stresses, and failure mode equations. Cost is free.
The Failure Rate Sources at a Glance
Cost bands: free / low (under roughly USD 250) / mid (roughly USD 250 to 1,000) / high (above roughly USD 1,000, or subscription only).
| Source | Granularity | Provenance | Last update | Cost | Notes |
|---|---|---|---|---|---|
| Plant data | Your device, your site | Counted | Continuous | Free | Feeds prior use under Clause 11.5.3. Only as good as the failure reporting behind it |
| Manufacturer’s FMEDA data | Manufacturer model | Computed | Per analysis | Free on request | Maintained by the manufacturer’s engineering and quality departments. The strongest fallback for a non-certified device |
| SILSafeData | Device category | Computed | Not stated | Free | Upper and lower λDU bounds by category. Checks a number from anywhere else |
| PDS Data Handbook | Component type | Counted | 2021 | Mid | Publishes the dangerous split and β, which few sources do |
| OREDA | Component type | Counted | 2015 | Mid | No dangerous split. Database restricted to consortium members |
| Goble and Cheddie, Safety Instrumented Systems Verification | Component type | Mixed | 2005 | Low | The failure rate, β and Cpt values behind its worked examples |
| Smith, Reliability, Maintainability and Risk | Component type | Mixed | 2021 | Low | Ranges rather than point values |
| Smith and Simpson, The Safety Critical Systems Handbook | Component type | Mixed | 2020 | Low | Data hierarchy guidance as much as data |
| CCPS Guidelines for Process Equipment Reliability Data | Component type | Counted | 1989 | Low | Static tables. The oldest process industry lineage |
| PERD | Component type | Counted | Ongoing | Subscription | Live successor to the book, with a process equipment focus |
| NUREG/CR-6928 | Component type | Counted | 2020 | Free | Device classes map directly onto SIF hardware |
| NUREG/CR-5497 | Component type | Counted | 2020 | Free | The largest published common cause failure dataset |
| Quanterion NPRD, EPRD, FMD | Generic part type | Counted | 2016 to 2024 | High | Counted field data, not a prediction model. FMD gives the safe versus dangerous split |
| Telcordia SR-332 | Generic part type | Computed | 2016 | Quote only | Telecom electronics, descended from Bellcore, now with Ericsson |
| Siemens SN 29500 | Generic part type | Computed | 2016 | Quote only | Works standard, thirteen parts, licensed to one named user |
| NSWC-11 | Generic component type | Computed | 2011 | Free | Valves, actuators, springs, seals and bearings, where certificates run out |
The table covers the usable failure rate data sources only. Everything in the section below is deliberately excluded from it.
Adjacent Failure Rate Data That Rarely Fits
Everything below comes up in conversations about failure rate data and answers a different question. The data is good. It measures something a PFDavg calculation does not use.
Initiating Event Data
The Risk Assessment Data Directory from the International Association of Oil and Gas Producers (IOGP), the Report 434 series, is free and covers process release frequencies, storage incidents, riser and pipeline releases, and ignition probabilities. Datasheets are revised individually, so the datasheet date matters more than the series date.
A release frequency per equipment-year is failure rate data aimed at the initiating event, feeding layer of protection analysis (LOPA) and quantitative risk assessment (QRA) one life-cycle phase before the PFDavg calculation.
The UK Health and Safety Executive’s Failure Rate and Event Data for use within Land Use Planning Risk Assessments, Planning Case Assessment Guide (PCAG) Chapter 6K, dated 28 June 2012, is no longer hosted on hse.gov.uk. Its valve section gives per-demand probabilities of failure that serve as LOPA independent protection layer credits:
- manual valve, 1E-4
- remotely operated shutoff valve, 3E-2
- automatic shutoff valve, 1E-2
- excess flow shutoff valve, 1.3E-2
Its electrical section states that HSE holds no agreed electrical failure rates, and refers readers to the PDS handbook, the Safety Equipment Reliability Handbook (SERH), and the IEC 61508 and 61511 series.
The Safety Equipment Reliability Handbook
The SERH is exida’s compilation of its own FMEDA results, 4th edition, frozen at 2015, roughly USD 795 per volume.
The three volumes are split by SIF element: Volume 1 Sensors, Volume 2 Logic Solvers and Interface Modules, Volume 3 Final Elements. The volume numbers are element categories and carry no revision meaning. A Volume 4 of generic data has been in development since 2015 and remains unpublished.
Certification status is a recorded field, so non-certified assessed devices appear alongside certified ones. Beyond the λ splits, the SERH carries useful life, six environmental profiles, internal fault detection time, and separate partial stroke rates on actuators.
It also records Route 1H and 2H classification, drawn from a separate exida field failure database of over 100 billion operating hours with a one billion hour threshold per component type. That answers the architectural constraint question.
If your device was assessed you already have its FMEDA data, and if it was not, the SERH does not have its failure rate data either. The ideal use is comparison shopping across vendors during conceptual design, and the occasional discontinued device whose manufacturer will no longer produce a current analysis.
Certificate Registries
Every certification body publishes a searchable record of what it has certified. The TÜV Rheinland functional safety product database and the TÜV SÜD certificate finder are the two most used. exida maintains the Safety Automation Equipment List (SAEL), and TÜV Nord and SGS-TÜV Saar publish their own.
Nothing in a registry entry, or in the certificate behind it, is failure rate data. There is no λ, no SFF, no diagnostic coverage, no PFDavg, no Cpt, no useful life. What you get is the certificate number, the holder, the product tested, the expiry, the SIL capability, and a pointer to the safety manual. The numbers live in the safety manual.
Registries are good for proving a device is not certified, catching an expired certificate, and testing a supplier’s SIL claim against the record.
Absence is not proof. A certificate holder can restrict publication, so a device missing from a registry may still have been certified.
SISTEMA and the Machinery Libraries
SISTEMA is free software from the German occupational safety institute IFA, with free manufacturer libraries at manufacturer model level in a format called VDMA 66413.
The failure rate data arrives as B10d, the number of cycles at which 10% of a tested population has failed dangerously. Converting that to a time-based rate needs the expected operations per year, and the count comes off a test rig under laboratory cycling.
ISO 13849-1 states that it does not apply to low demand mode and points to the IEC 61508 series instead. B10d comes from parts that cycle constantly, and a low-demand final element may stroke a handful of times a year.
The narrow case where it travels is a frequently cycled electromechanical part in a trip circuit: a relay, a contactor, or a solenoid.
Military Prediction Handbooks
MIL-HDBK-217F Notice 2 is free and still widely cited, frozen since 1995, with computed failure rate data that was criticized as unrealistic well before the updates stopped.
Its successor, 217Plus:2015 Notice 1, is sold by Quanterion, the firm that took over the former Defense Department Reliability Information Analysis Center (RIAC) product line. The lineage runs MIL-HDBK-217, PRISM, RIAC 217Plus, 217Plus:2015.
MIL-STD-1629A and MIL-HDBK-338B are a common wrong turn. Both are procedure documents carrying no failure rates at all, and both point back to MIL-HDBK-217 and the Quanterion databooks for failure rate data.
The GIDEP Repository
The Government-Industry Data Exchange Program (GIDEP) costs nothing. The barrier is eligibility.
Membership is open to US and Canadian organizations supplying under contract to the US Government or the Canadian Department of National Defence, to US Government agencies, to Canadian DND and CSA, and to licensed US public utilities. Joining requires Proof of Doing Business, a government contract or purchase order dated within the last six months. A licensed utility qualifies. An independent refinery or a solo consultancy does not.
“Failure Rate Summaries” is legacy naming carried over from MIL-HDBK-338B. GIDEP now holds reliability and maintainability data as member-submitted reports in their original unedited formats, so it functions as a searchable repository of failure rate data submissions.
Electrical Power Data
IEEE 3006.8-2018 is the current home of equipment reliability data for industrial and commercial power systems, covering transformers, breakers, cables, and motors. Practitioners still call it the Gold Book after IEEE 493, whose last edition was 2007 and which is now inactive-reserved.
The content is availability-oriented survey data with no dangerous split, so failure rate data taken from it needs that split argued from somewhere else. Useful for power supply context, and rarely for SIF devices.
Common Cause Failure Data
β is mostly not a database problem. Only a handful of failure rate data sources publish β values at all.
IEC 61508-6 Annex D is the usual route instead of a lookup. It provides a checklist covering separation, diversity, complexity, and operational factors, converted to a β estimate through the annex’s own tables. Smith’s BETAPLUS is a refinement of the same idea.
The PDS Data Handbook holds the most complete published set of β values by device category, and that is a large part of why it stays in use.
NUREG/CR-5497 gives free nuclear CCF parameter estimates by component type, and it is the largest published CCF dataset there is.
Goble and Cheddie’s worked examples run 2% on redundant pressure transmitters and 10% on valves and position switches. A good many project defaults trace back to those numbers.
Proof Test Coverage Data
Cpt is the thinnest of the three. The SERH is likely the only published multi-vendor Cpt compilation, and outside it there is no database to search.
The FMEDA is the only device-specific source, whether it reaches you through a safety manual or direct from the manufacturer. Coverage is not inherent to the analysis. It appears when the FMEDA is extended to score a proposed proof test procedure against the device’s failure modes, and the figure that comes out belongs to that procedure on that device. Published class-level typicals, like Goble and Cheddie’s tables, give you a starting point for an estimate. They do not give you a device value.
With no FMEDA, the number has to come from your own analysis of your own proof test procedure, documented as such.
Typical Values for a Mental Model
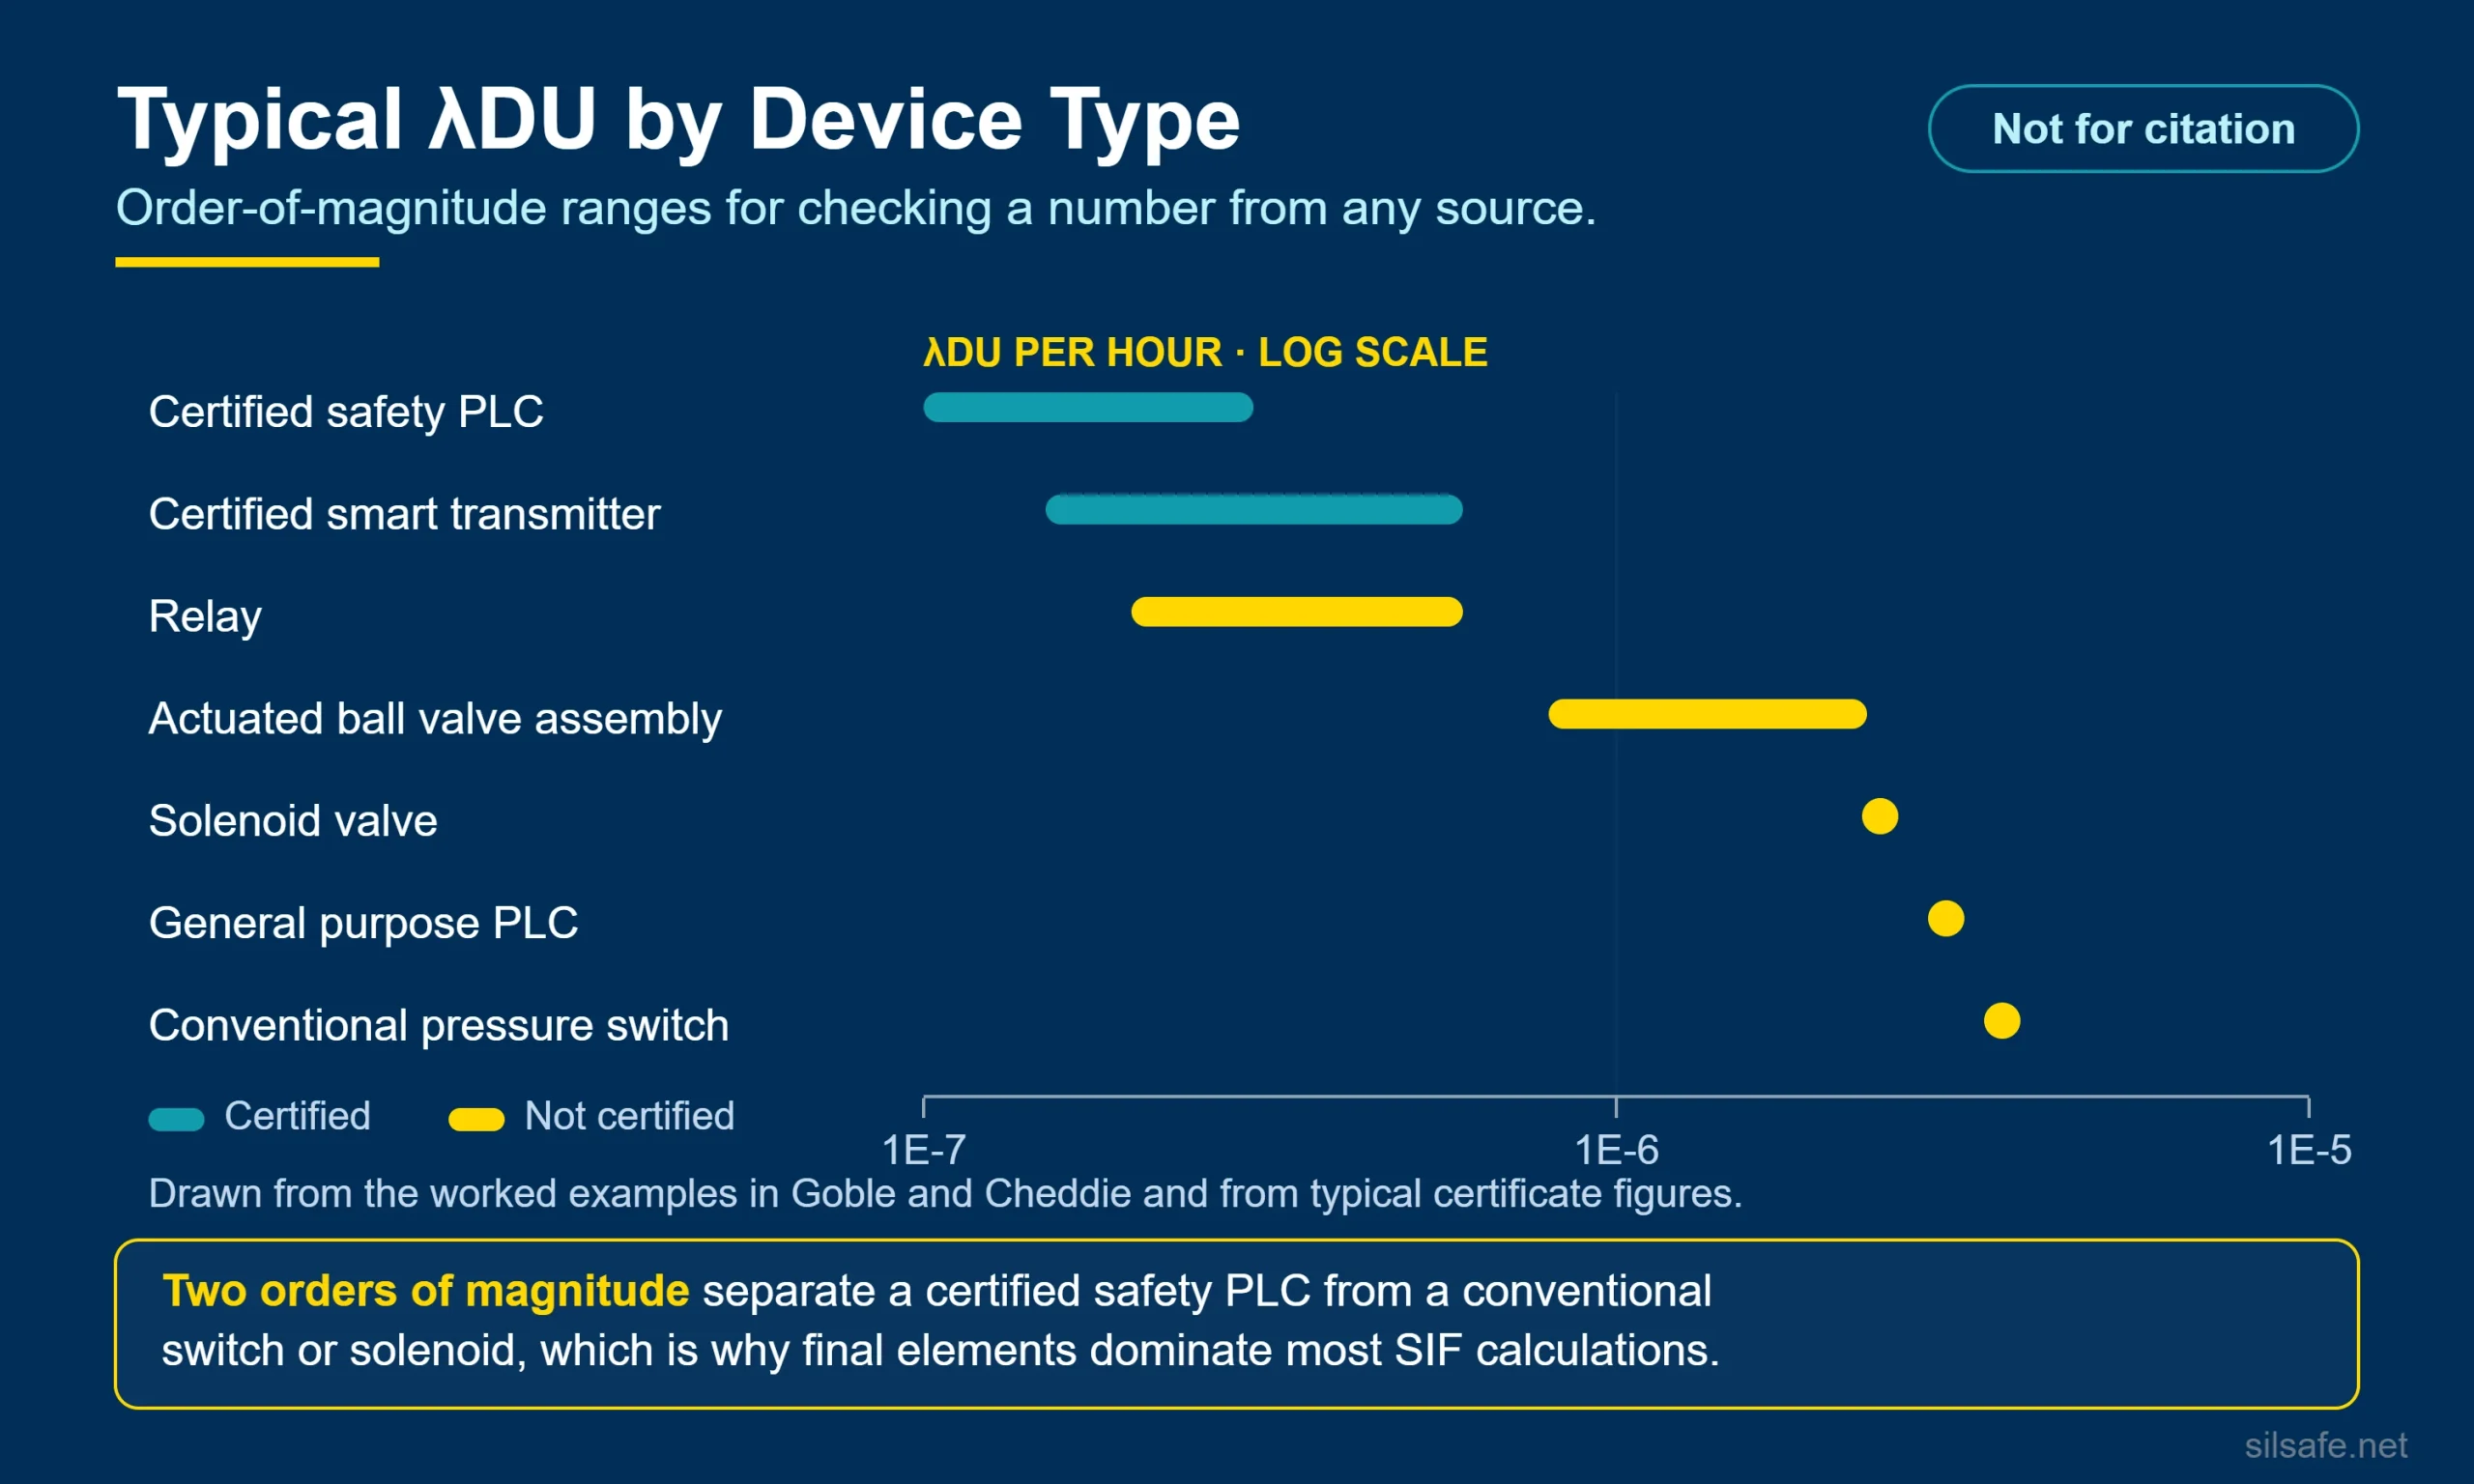
These are order-of-magnitude ranges for sanity-checking a number from any failure rate data source above, drawn from the worked examples in Goble and Cheddie and from typical certificate figures. Use them to calibrate your judgment. Do not cite them.
Failure Rate
λDU per hour:
- Certified safety PLC (programmable logic controller): 1E-7 to 3E-7
- General purpose PLC: roughly 3E-6
- Relay: 2E-7 to 6E-7
- Certified smart transmitter: 1.5E-7 to 6E-7
- Conventional pressure switch: roughly 3.6E-6
- Solenoid valve: roughly 2.4E-6
- Actuated ball valve assembly: 8E-7 to 2.3E-6
Two orders of magnitude separate a certified safety PLC from a conventional switch or solenoid, which is why final elements dominate most SIF calculations.
Common Cause Failure
β runs roughly 0.5 to 5% for logic solvers and 1 to 10% for field devices. Project defaults of 5% on instruments and 10% on final elements are the most commonly seen.
Proof Test Coverage
Cpt runs roughly 70% on an actuated valve, 80% on a solenoid where the test strokes it, 90% on a relay, 95% on instruments, and 100% on a safety PLC. Claiming higher than these typicals requires FMEDA-level justification.
Justifying Your Data Source
IEC 61511 Clause 11.9.3 sets the bar. Reliability data has to be credible, traceable, documented, justified, and based on field feedback from similar devices used in a similar operating environment.
The hierarchy that follows from that, strongest first:
- your own plant data
- industry counted data
- generic published tables
- computed prediction models
What an assessor probes is the three properties from earlier applied to your device. Environment: clean-service failure rate data in a fouling application fails the similarity test. Granularity: state the typical-of-its-class assumption explicitly. Provenance: label a computed number as computed.
Mixing failure rate data sources within one SIF is normal. A certificate for the transmitter, plant data for the valve, and published tables for the interposing relay, each justified on its own. SILSafeData is the quick screen across all of them.
The source, the edition, and the applicability argument belong in the safety requirements specification (SRS) or the verification report at calculation time. Reconstructing all three at audit time is considerably harder.
Life-cycle Placement
Before any of this, the hazard and risk assessment (H&RA) and SIL allocation set the target that the failure rate data has to prove, and the SRS captures the required PFDavg or risk reduction factor (RRF).
The failure rate data lookup itself lives inside SIS design and engineering, where SIL verification consumes the failure rate, β, and Cpt inputs.
Common Mistakes
- Buying the non-certified version of a device to save money on the purchase order. You pay for the failure rate data either way. With the certified device the manufacturer paid once and priced it in. Without it, your engineers pay every time the device appears in a calculation.
- Reaching for the nearest entry in a failure rate data table instead of the nearest match to the device. A pressure switch given pressure transmitter data is the classic version: different construction, different failure modes, no diagnostics, and a dangerous fraction that is not comparable.
- Taking a mean time between failures (MTBF) figure off a manufacturer’s cut sheet and treating it as failure rate data. It carries no dangerous fraction and usually no stated method, and it exists to win a purchase comparison.
- Choosing the failure rate data source component by component according to which number helps the result. A certificate here, a generic table there, and whichever β closes the gap. Each choice is defensible on its own, and the pattern across the SIF is what an assessor notices.
- Building plant failure rate data from maintenance records that do not capture every failure. The arithmetic is right and the answer is optimistic by an unknown amount, which is worse than having no number at all.
- Recording the source but not the edition or the date. That leaves the calculation unreproducible at the next assessment.
Frequently Asked Questions
We run a small SIS with only three SIFs, and we make a point of procuring only devices that carry SIL certificates. I don’t need to mess with any of these databases, right?
Right. The certificate and the safety manual carry the failure rate data, and for a small certified SIS that really is the whole job. What is left is confirming that your operating environment matches the assumptions the certificate was written against, then following the safety manual on diagnostics, proof testing, and useful life. That part is real work, and none of it involves a database.
Some of these sources give me a number for the exact model I bought, and some just say “ball valve.” Does that difference actually change anything in my calculation?
Not really. The generic number goes into the calculation the same way the model-specific one does. What changes is what you owe the assessor, because you are now assuming your device is typical of its class. Say so, give a reason, and write it down where the number is used. An unstated assumption is what gets flagged.
How do I tell whether a published failure rate was counted from real failures or computed from somebody’s model, and should I care?
Every source of failure rate data states its own basis somewhere in the front matter, so read the methodology section before you read the tables. And yes, care, though probably less than you would expect. It changes how hard you have to work to defend the number and rarely decides whether you can use it at all. Label a computed number as computed and move on.
All of this data seems to intertwine with proven in use and prior use. Is that right?
Yes, and the two terms get used interchangeably when they mean different things. Prior use is the facility-side path in IEC 61511 Clause 11.5.3, justified on your own operating history with your own device in your own service.
Proven in use is IEC 61508 Route 2S, a manufacturer-side route resting on the vendor’s field return population. Plant data is what feeds a prior use file. Published generic tables can support either argument and satisfy neither on their own.
I need a number to finish the design of this SIF and I am not getting budget approval for a data source. What can I actually get for free?
More than you would think. For a PFDavg calculation the free failure rate data set is SILSafeData for a plausibility check, the two nuclear NUREGs, NSWC-11 for mechanical items, and your own plant records. Ask the manufacturer for the FMEDA first, since an assessed device comes with one at no additional charge and it beats everything else on that list.
One warning: free is not the same as applicable. SISTEMA, MIL-HDBK-217F, and the IOGP and HSE directories are all free, and all of them answer a different question.
My valve’s safety manual gives a proof test procedure but never states a coverage number. What am I supposed to put in the calculation?
Go back to the manufacturer first and ask for the FMEDA. It may carry a coverage figure, since some FMEDAs are extended to score a proposed proof test procedure, and even when it does not you get the dangerous undetected failure modes to work from. This is an odd gap and a shrinking one, since safety manuals increasingly state Cpt outright. If nothing comes back, derive the number by comparing your procedure step by step against the device’s failure modes, then document that derivation as the source. A derivation you can defend beats a borrowed typical value.
Further Reading
From SIL Safe
- Failure Rates in Functional Safety
- SIL Verification: The Three Gates
- PFDavg Explained
- Proof Test Coverage (Cpt) to Improve PFDavg
- How to Apply Beta Factor for Common Cause Failure
- Who Certifies Functional Safety Equipment?
- The History of Functional Safety
External resources
- OREDA handbook
- SINTEF Reliability Data for Safety Equipment (PDS Data Handbook)
- Goble and Cheddie, Safety Instrumented Systems Verification: Practical Probabilistic Calculations (ISA, 2005)
- Smith, Reliability, Maintainability and Risk, with FARADIP.THREE and BETAPLUS
- Smith and Simpson, The Safety Critical Systems Handbook
- SILSafeData
- CCPS Guidelines for Process Equipment Reliability Data
- CCPS Process Equipment Reliability Database (PERD)
- NUREG/CR-6928
- NRC reactor operating experience results and databases
- NUREG/CR-5497 CCF parameter estimations, current update
- Quanterion reliability data resources: 217Plus, NPRD, EPRD, FMD
- Telcordia SR-332
- Siemens SN 29500
- NSWC-11 Handbook of Reliability Prediction Procedures for Mechanical Equipment
- IOGP Risk Assessment Data Directory
- HSE Failure Rate and Event Data for use within Land Use Planning Risk Assessments
- exida Safety Equipment Reliability Handbook
- TÜV Rheinland functional safety product database
- TÜV SÜD certificate finder
- IFA SISTEMA manufacturer libraries
- ISO 13849-1:2023
- MIL-HDBK-217F Notice 2, MIL-STD-1629A, and MIL-HDBK-338B
- GIDEP membership eligibility
- IEEE 3006.8-2018
- IEC 61508-6:2010
This one took serious research time, and the failure rate data landscape keeps moving. Sources get renamed, handed to a different organization, frozen, and quietly withdrawn, and something on this page is almost certainly out of date or wrong by the time you read it. If you spot it, leave a comment or send me an email and I will fix it.
Functional safety is complex, and the stakes are high. If you have questions about your SIS design, SIL verification, or where to start with IEC 61511, the team at SIL Safe is here to help. Reach out to us today.